This is the continuation of a long series of posts, the last of which can be found at: ARCTIC SEA ICE MELT —Flat-lining Death Spiral—
I’m going to skip my usual introduction. Those interested in seeing my evolving views can research earlier posts, and their introductions, which include a certain amount of contradictions. (For example, I may state I’m fed up with politics and am going to exclude it from my observations, and then some event will trigger a rave.)
Instead I am simply going to state it has become all too clear there is no “Death Spiral” occurring at the Pole. All the hoop-la and press about a Doomsday scenario was much ado about nothing. Not only is the Pole failing to melt away, the Pole isn’t even managing its ordinary amount of melting.
I’ve been following this issue carefully since the low-ice summer of 2007, and I would like to remind people what we were told. We were told that the lack of ice would involve a scientific-sounding word (which my spell-check still doesn’t believe exists), called “albedo,” and rather than the arctic reflecting incoming sunlight, the darker water would absorb it, and the Arctic Sea would become warmer until there was no ice. Rather than a benign situation, giving the east coast of Greenland a more maritime climate such as the Vikings experienced in the year 1000, an ice-free Arctic Ocean was portrayed as a “tipping point” that would trigger other warming events, leading to “runaway warming” that would threaten the very survival of humanity. We were told immediate actions must be taken. We were informed that already the situation was so dire that the Arctic Sea was likely to be ice-free as early as 2012 or 2013.
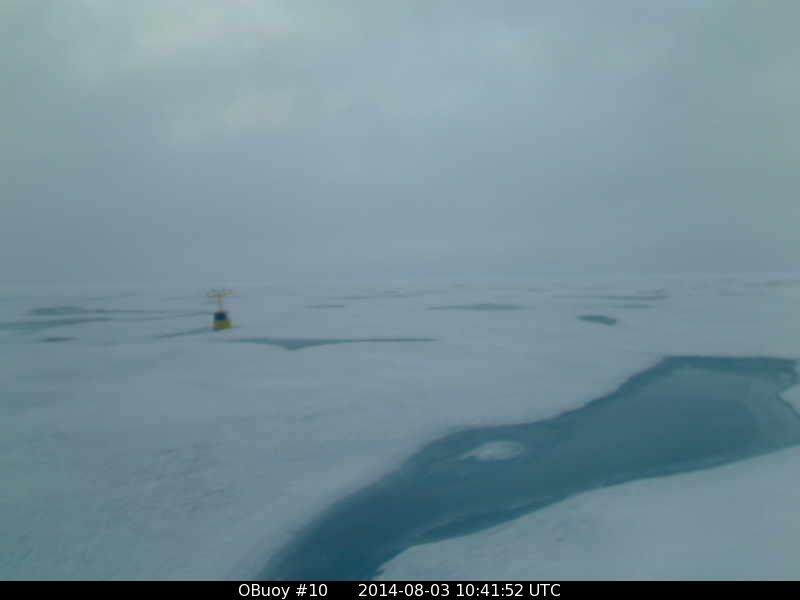
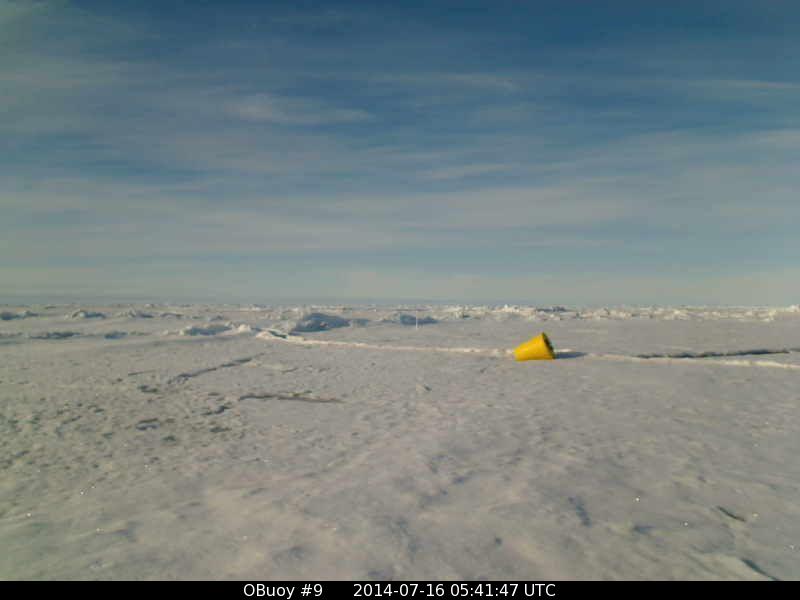
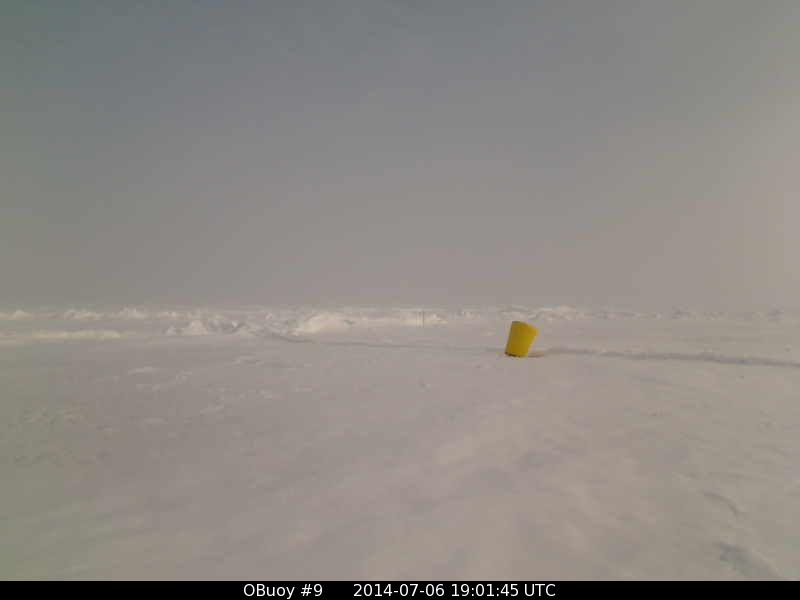
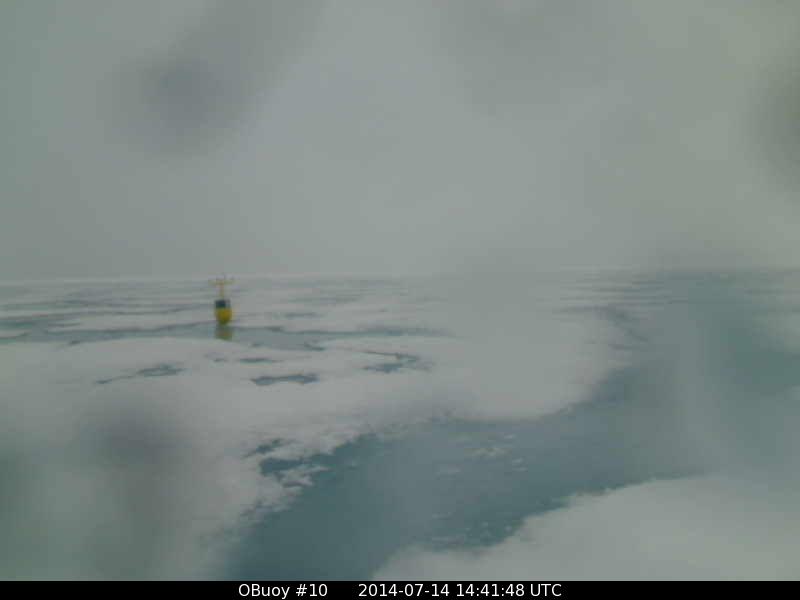
So here we are, at the height of the melt season, when temperatures are at their warmest at the Pole. Let us travel up there and see what we see:  What we see is a surprisingly solid ice-pack, without even the ordinary melt-water pools, blanketed by a light, fresh fall of snow.
Remember that scientific-sounding word “albedo”? If you check your charts, you will see nothing on earth reflects away sunlight as well as a fresh fall of snow. In other words, even if you accept the Alarmist’s theory that open water will absorb more sunlight and lead to runaway warming, there is no open water to see. There are no melt-water pools to see. There is only freshly fallen snow, with the highest albedo nature can produce. Only covering the pole with shiny foil could possibly reflect more sunlight than what you are seeing with your lying eyes.
Last year, though the ice was solid, at least we had some fine examples of melt-water pools. In fact a large pool roughly the size of a football field appeared right in front of our camera, and looked like this:  Certain media outlets thought this pool of July 26 was a great excuse for screaming headlines, “North Pole Melting!” The problem is, such melt-water tends to find fissures in the ice and drain away, and no sooner had the media attracted attention than the picture looked like this on July 28:
  and a few days later (July 31) snow fell and it looked like this:
  The same media outlets that made such a big deal about a melt-water pool became absolutely silent when the scene changed in a matter of days, and have remained absolutely silent this summer. Perhaps they can’t sell as many papers by saying, ” The world isn’t going to end, after all.”
This is not to say that there still isn’t time for a sensationalist headline, this summer. Just as it snows in July at the Pole, it can rain, and we may get a pool. What is more, there is a crack in the ice just behind the yellow cork-like object on the ice in the first picture, and a second crack in the middle of the nearest pressure ridge crossing the scene. Either or both could open into what is called a “lead,” as we saw in front of the North Pole Camera 2 this year before it was demolished by a growing pressure ridge. (See earlier posts.) The media missed a golden opportunity for hysteria there. Any sign of water at the Pole can generate headlines.
However open water isn’t that unusual. If you look through my earlier posts you will see old pictures of submarines surfacing at the Pole in open water a half century ago, and a lead opening up right in the middle of a scientific base (where cargo planes were landing 60 days earlier) in the 1970’s. The only reason open water is deemed newsworthy now is because it is attached to the end-of-the-world “Death Spiral.”
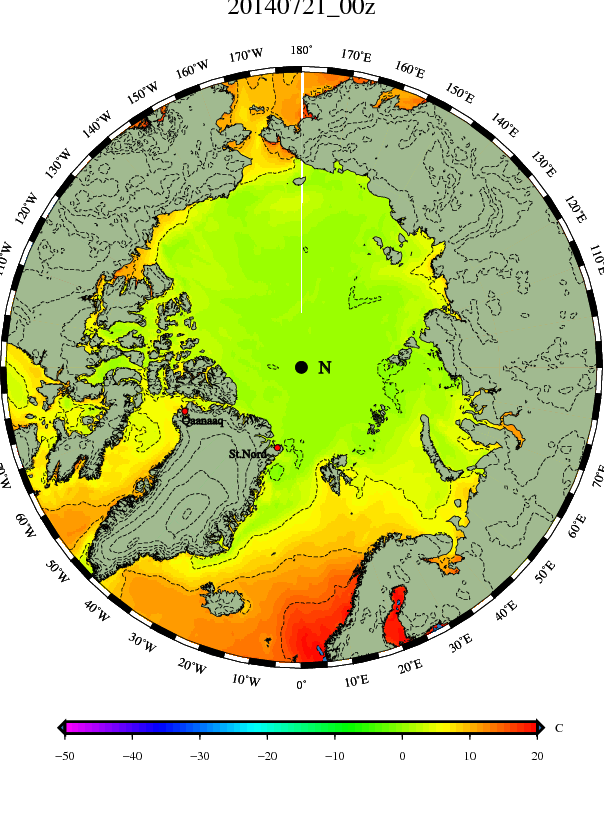
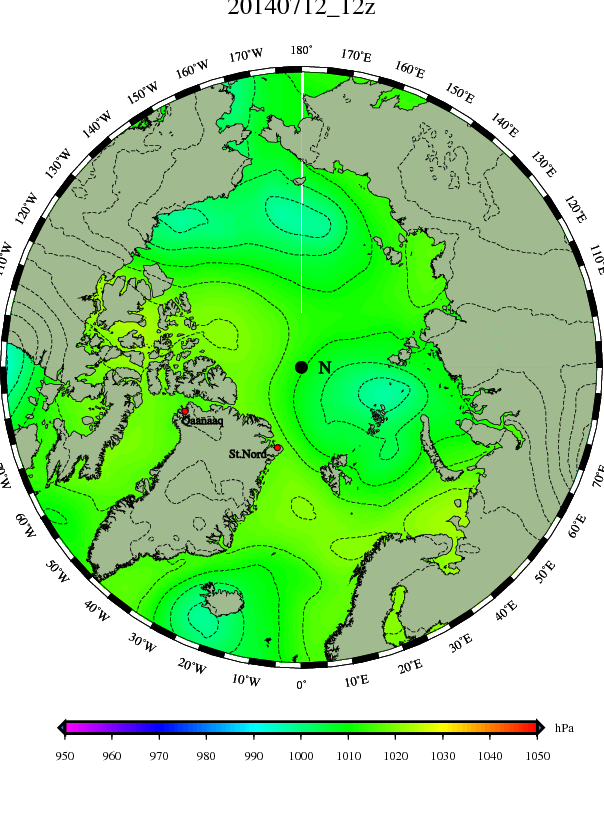
Sorry, but it ain’t goin’ t’happen, this year. First, the ice is refusing to melt in a speedy fashion, and in September may even show an increase from recent years: 
This refusal of ice to melt suggests the Arctic Ocean is very swift to respond to the AMO (Atlantic Multidecadal Oscillation) becoming “cold.” The AMO is not due to turn permanently “cold” for another five years, but currently is going through a sort of spike away from the “warm” phase. Of course, it may be turning to its “cold” phase five years early, which would be newsworthy, (but they’d ignore it), however I expect it to switch back to “warm,” and for arctic sea-ice to decrease again next year. But, if the media starts to scream about a “Death Spiral” all over again, they will look a little foolish, because it will be so obvious the ice actually is responding to the AMO.
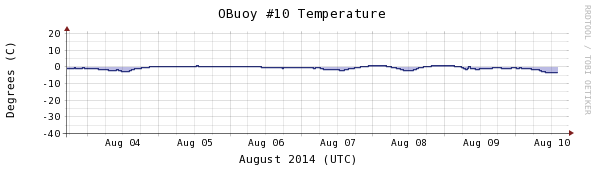
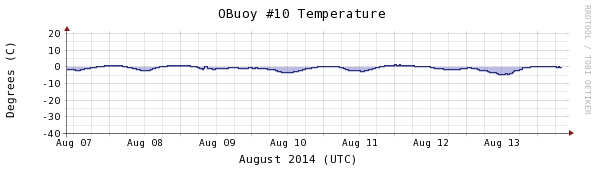
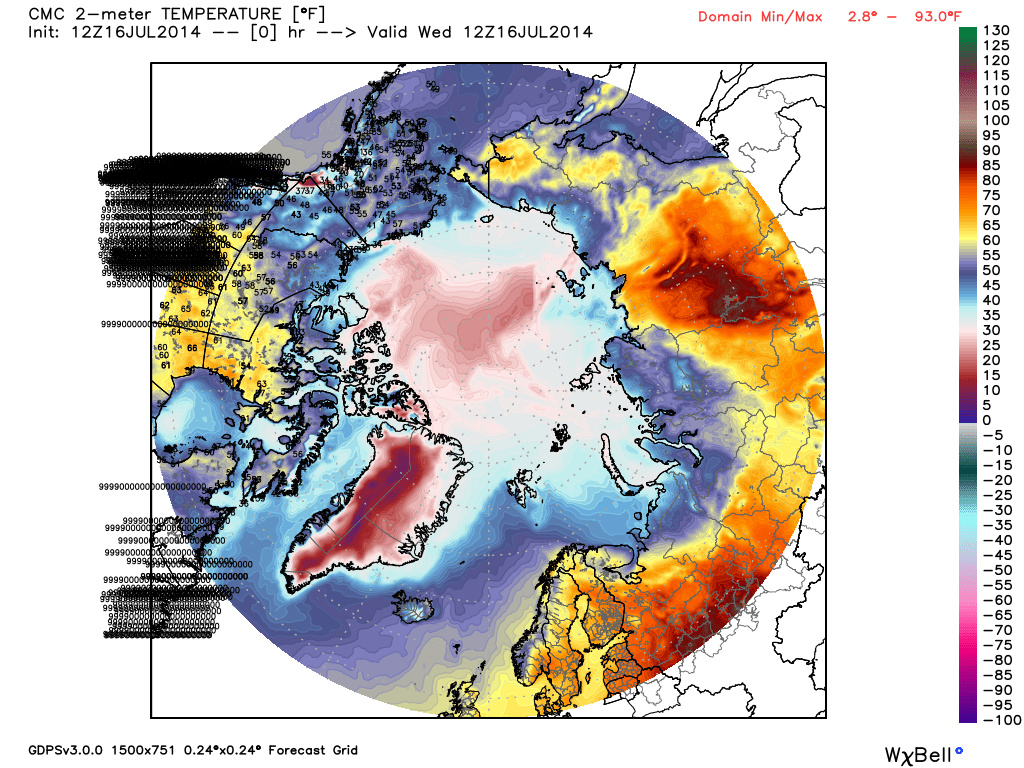
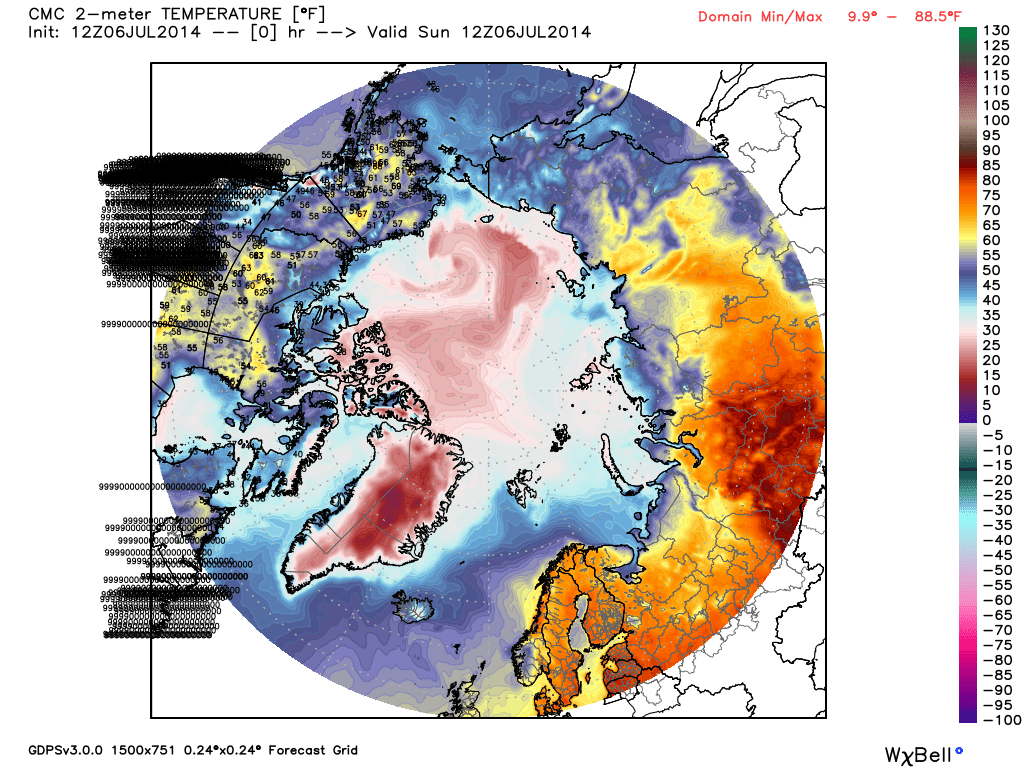
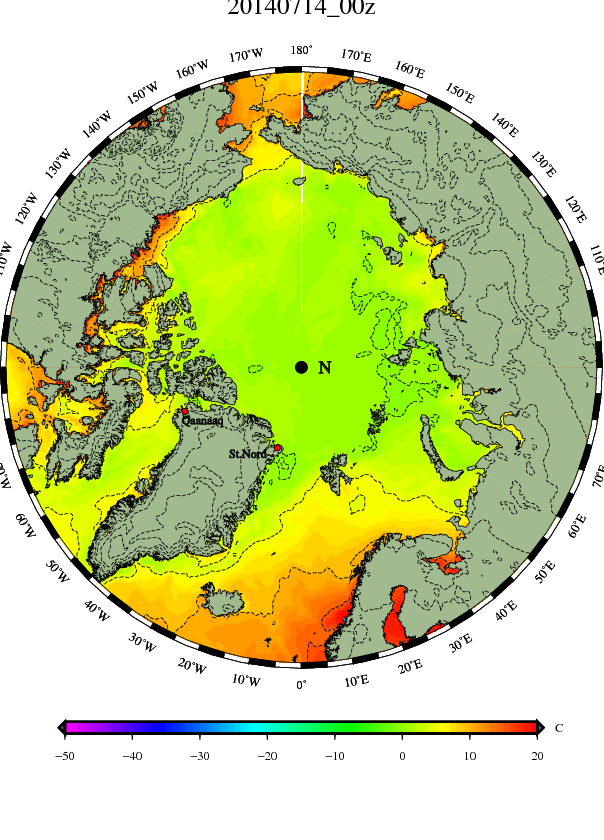
Second, for the second straight summer it has been colder than normal over the Pole. 
This chart is especially interesting when you notice how much colder this summer is than the summer of 1979, when Alarmists say it was colder and the ice was more “healthy,” (but much more slush and melt-water was evident at the surface.) 
There are interesting arctic dynamics being revealed by Mother Nature in these two graphs, but a “Death Spiral” isn’t one of them. In fact the entire business of a “Death Spiral” increasingly seems like a a sort of fraud created by people who lack a real purpose, and don’t truly understand the meaning of the word, “death.”
This was driven home to me by the simple fact I faced two funerals this past week, and had to think about death, which I ordinarily avoid thinking about. In the sadder example a young father was out enjoying relief from the summer heat on his motorcycle, and his life ended instantly when another driver simply didn’t see him. A mother instantaneously became a widow with two sons to raise. She now has to find a way but cannot see a way.
That is the sort of real problem real people deal with. Their plans and hopes and entire world really does end, yet they must go on. The last thing such real people need is some untrue theory about a “Death Spiral” that doesn’t exist, and about some end-of-the-world that isn’t going to happen, justifying extra taxes that accomplish nothing and help no one, except for the leeches sucking those taxes up.
In any case, this summer has debunked the “Death Spiral.” I’ll continue my observations until the melt season is officially over, but as far as I’m concerned the argument is over.
*******
Sorry if that came across as overly grumpy. It’s just that sometimes those so-called “experts” get to me. How they can pat their own backs and think they are saviors of humanity is incredible, considering they haven’t a clue what humanity entails.
Now I am swearing off politics, and am planning to return to the arctic sea ice seeking what I originally sought: Truth and Beauty. For there is a peace found in merely watching clouds form, or watching ice melt, that is unlike any gains gleaned by human pursuits.
*******
CRUNCHED CAMERA REPORT
(This report, first time visitors will be interested to know, likely describes the weather surrounding the crushed ice-floe where the ruins of our North Pole Camera lie, for the attached weather station is still reporting. There is a slight chance the weather station fell into the sea and now bobs as an independent buoy, unattached to any ice. (This was the fate of last year’s weather station, which eventually grounded on the north coast of Iceland.) However the satellite view shows little open water between the many floes and bergs, and I think it is unlikely our weather station is in the water yet.)
Our crunched conglomeration of high tech concepts drifted on light, predominately west winds of 5-10 mph, easing south to 84.714°N at 3:00 PM, bumping back north to 84.719°N, before ending the 24-hour period at 9:00 PM at 84.712°N, 17.122°E. This is the furthest east we’ve reached at any time this summer.
Temperatures reached a high of +0.2°C yesterday afternoon, and then sank to a surprisingly low -2.1°C at 6:00 AM, before rebounding to -0.9°C at 9:00 AM.
Pressures rose slowly to 1009.1 mb
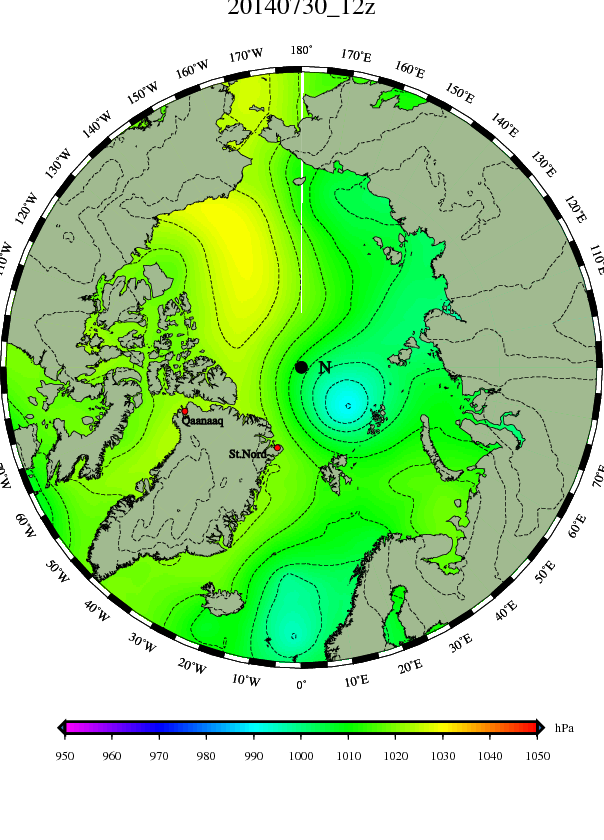
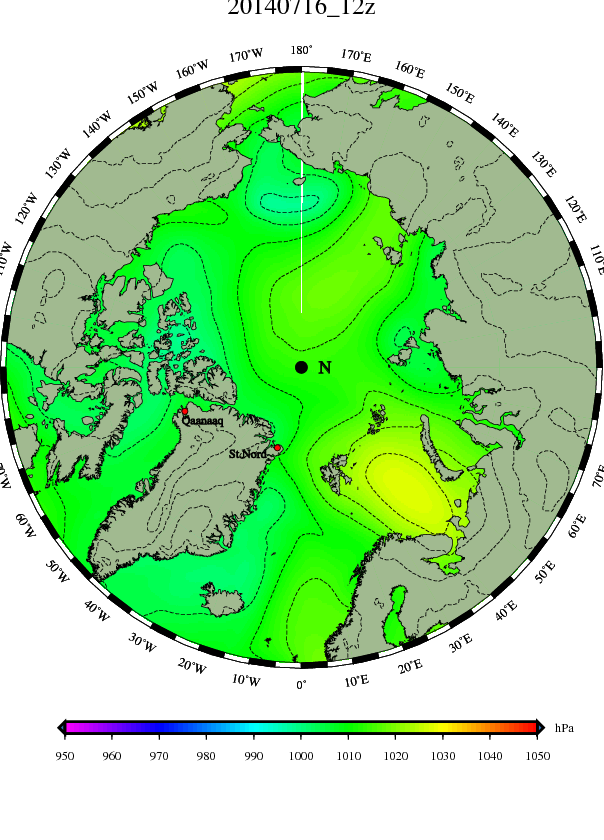
JULY 27 —DMI Afternoon Maps—


Midnight is at the top of these maps and noon at the bottom, which heightens the Scandinavian warmth and deepens the chill towards the Bering Straits. “Art” and “Stepper” are joining forces over the Pole, creating a warm flow north through the Laptev Sea and a cold flow down into the Kara Sea. “Gus” is just appearing on the map, southeast of Greenland, as the high pressure “Scanty” reluctantly bids adieu and eases southeast off Scandinavia.
NEW CAMERAS —Cold continues—
These pictures are the O-buoy cameras 9 and 10, which I turned to when our old and faithful North Pole Camera lost its showdown with a pressure ridge.
Camera 9 has drifted quite close to the Pole, around a hundred miles to the Canadian side, and much closer than the North Pole Camera would be, as it drifted 300 miles south before getting crushed. O-buoy 9 sits on roughly four feet of multiyear ice. On clear days the satellite view shows this ice may have been fractured last summer, but was refrozen into a fairly solid sheet last winter, and hasn’t been broken up by the series of Polar storms. The ice 300 miles south at the NorthPole Camera was, on the other hand, very shattered.
There is an obvious crack visible in the picture, however no sideways motion associated with it. A less visible fault is in the pressure ridge that crosses the view in the near background. Around three weeks ago the entire background shifted roughly six feet left, and then, after several days, shifted six feet to the right, back to its original position. In a sense this ice is solid like California is solid. It has its own San Andreas Fault.
This view demonstrates a sort of white-out different from the ones caused by blowing snow. This one is caused by fresh snow and cloudiness causing a complete lack of shadows. Adventurers complain they stumble as they walk, for they can’t see the unevenness of the ground.
Temperatures did thaw briefly, earlier, but have fallen below freezing again.


Our southern view is roughly 800 miles south of the Pole, at 77 degrees north latitude, north of Alaska in the Beaufort Sea. With the sun higher and stronger at noon, and never quite setting at midnight because it is north of the Arctic Circle, the melting is more intense and melt-water pools more common. In fact here is a picture from somewhere around five to ten years ago, showing just how many melt-water pools there were on the ice floes.
.
Some Alarmists said that there were more of these melt-water pools than there formerly were, and that their increase was a proof of Global Warming and the “Death Spiral” and the eventuality of an Ice-Free-Pole. This year those pools started to form, but recently have refrozen. They are not suppose to do that, if you believe in the “Death Spiral.” However they don’t seem to care a hoot for political correctness, and the current picture shows they are continuing to stay frozen, and that temperatures remain below normal. (By the way, all pictures and graphs in this post can be clicked, to give you a larger and clearer image.) 
 JULY 28 —DMI Morning Maps—


“Art” continues to retain its identity over the Pole, which is something of a surprise because, last week, models suggested it would have faded by now. Perhaps it is being fed by a plume of mild moisture “Stepper” is bringing up through the Laptev sea. As “Stepper” moves up to join “Art” and they wobble off towards Canada the part of Stepper left behind in central Siberia, “Stepperson,” will gather strength and be the next low to gain king-of-the-world status atop the Pole, by Wednesday evening.
Meanwhile “Gus”, now approaching Iceland from the west, will attempt to be the first storm in a long while to successfully cross the Atlantic and cross northern Scandinavia on Thursday, and likely be sitting where Stepperson now sits south of the Kara Sea by next weekend. However that far out models are not to be trusted.
If Gus actually does plow through northern Scandinavia the Baltic will see the warm east winds give way to west winds off the Atlantic for a while, though high pressure and east winds are likely to return after Gus passes.
Remember it is noon to the top of the above maps and midnight to the bottom. It is surprising to see so many blobs of subfreezing temperature isotherms up that way, during the warmest part of the day. The subfreezing air north of Svalbard and in the Kara Sea demonstrates that the warmth over Scandinavia is denied access to the north, though perhaps the passage of “Gus” will change that.
NEW CAMERAS —The gray chill continues—
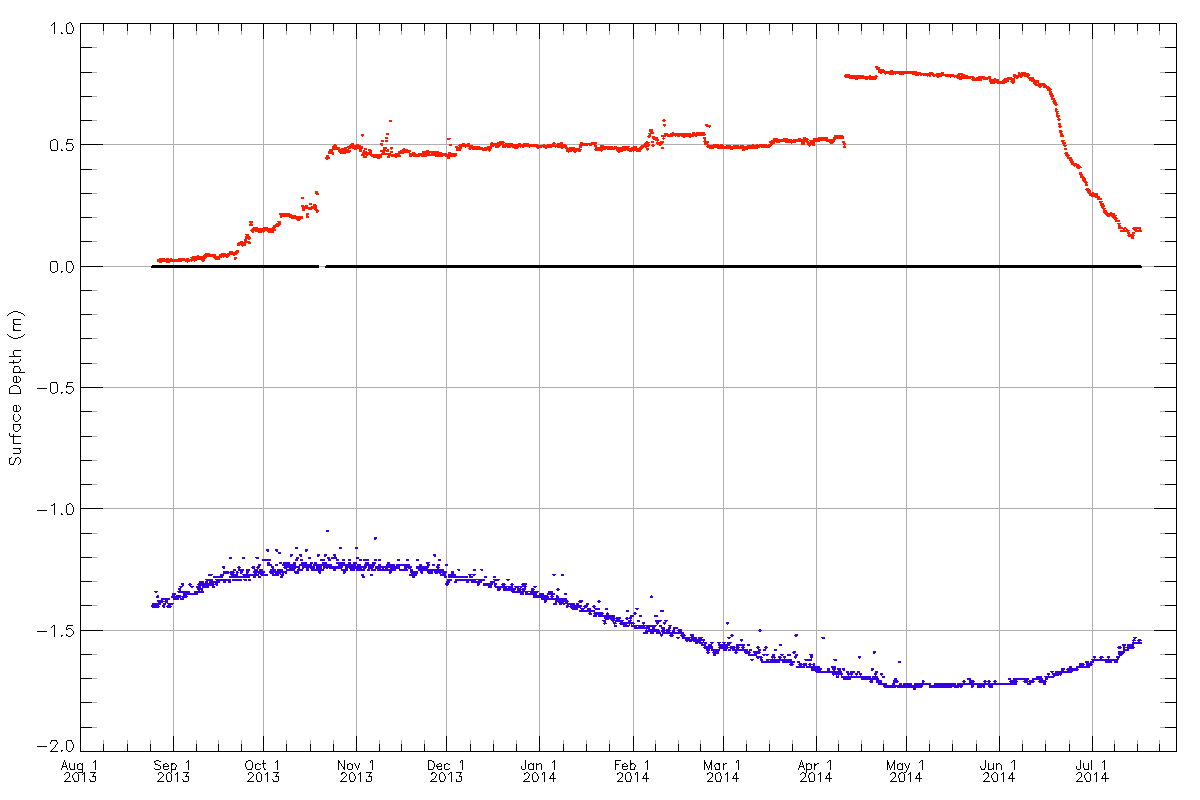
Our northern camera sees a bleak, cold view, with a lack of thawing. The recent snow was quite light, only an inch or two, and ordinarily would swiftly sag into gray slush. The fact it is still white demonstrates how cold it has been. Most of the melting comes from below. Remember that nine-tenths of an iceberg is under water, and though that pressure ridge in the background may only be three feet tall, it has a keel sticking 27 feet downwards. Because the water it sticks into tends to be just above the freezing point of salt water, and the ice is fresher water, the melting is slow, but it does melt away gradually. As the keel gets smaller below the pressure ridge slumps down above, and I think those ridges do look smaller than they were in April. I wish they’d fix the Army site, which is still reporting data from July 22. I imagine the guy in charge took a well-earned vacation, and his replacement is like me, and all he needed to do was touch the computer to screw everything up. However, when the regular guy gets back, we can see if the ice is getting thinner, at certain buoys that measure such things.  Our southern camera shows some fog, which ordinarily indicates thawing, especially as fog releases latent heat when it condenses on snow, (or on the outside of your cold drink’s glass on a muggy summer day). However the thermometer continues to show subfreezing temperatures. Likely the warmth is aloft, perhaps only a hundred feet up, and an inversion keeps the cold clamped onto the ice. In any case, the thaw is still on hold.
I would like to predict an Alarmist response to the lack of thawing, before it happens. They will state, “Oh, it is just a weather pattern, which has increased the cloudiness and prevented the albedo from being high.” I will remind them I was never allowed to suggest it was “just a pattern”, back when the melting was occurring. Even if I merely asked, “Could it not be just a pattern?” I was scorned and called a “denier,” among other things. I’ll try not to call them any names, (beyond the quite correct term “Alarmist,” for they are alarmed and that is the dictionary definition.) However I will ask, “How is it you allow yourself what you would not allow me?”
CRUNCHED CAMERA REPORT
After a brief westward wobble at noon yesterday, our heap of junk moved steadily east In a light breeze if 4-9 mph, at first veering a little south to 84.671°N at midnight, and then backing a hair north to 84.681°N at 6:00 AM, before a final lurch south to finish at at 84.679°N, 17.513°E at 9:00 AM. The temperatures remained below freezing throughout the 24-hour-period, which is no way to run a thaw. It included a twelve-hour-period below the freezing point of the slightly brackish seawater, dropping from -0.9°C at 9:00 AM yesterday past -1.7°C at 3:00 PM to the low of -2.5°C at 9:00 PM remaining there past midnight and only nudging up to -2.2°C at 3:00 AM, only passing the freezing point of saltwater before 6:00 AM and arriving at the days high of -0.7°C at 9:00 AM. There’s some darn cold air circulating around the Pole this summer. The pressure slowly rose to 1011.7 mb.
JULY 28 —-DMI AFTERNOON MAPS—


Even as “Art” slides off the Pole towards Canada “Stepperson” is moving north through the western Kara Sea to take its place as the top-of-the-world Low. “Gus” is moving over Iceland on his way to Norway. Though the high pressure “Scanty” has faded down into Ukraine the warmth lingers over Scandinavia. The cold persists towards Being Strait, despite a finger of warmth poking north through the Laptev Sea.
NEW CAMERAS —Hints of sun and thaw?—
In wan sunshine, with temperatures just touching freezing, I see a few signs the thin snow cover may be thinning to a slight degree. Partly this may be due to sublimation, though humidity is high.  Our southern buoy also shows signs of wan sunshine, and temperatures have also risen and touch freezing. Of you look at the largest melt-water pool to the lower right, the surface appears more like slush than smooth ice. Also a sort of island to the pool’s left side is reappearing, after being hidden by snow for a while.
  THE RARITY OF WHAT WE ARE SEEING
I just went through 50 years of DMI polar temperature graphs, and only 1969, 1972, and 2010 have the graph dip as low as it now dips, right when it should be at its highest. Here is the 2010 graph, followed by the 2014 graph. 
 JULY 29 —DMI MORNING MAPS—


I tend to sip my coffee in the morning, and blearily regard these maps, looking for what I didn’t expect. Noon is to the top, and midnight at the bottom.
“Art” drifts towards Canada as expected, but is drawing up more warmth on its east side than I expected, and is retaining more strength than I foresaw.
The sub-freezing pockets of cold north of Alaska, despite the warmth of the day, have been there so long I’ve come to expect them, though I can’t explain them. How is that home-grown cold created?
“Stepperson” is moving up towards the Pole, but I expected it to pull more warmth up its east side than I see. The Laptev Sea seems bounded by subfreezing pockets of cold.
“Gus” is proceeding from Iceland towards Norway as expected, but I’m leery of that meek bit of high pressure standing in its way, northwest of Norway. Scandinavia has rebuffed so many storms this summer that I half-expect the same to happen to Gus, though the models still forecast Gus to plow right through Northern Scandinavia.
NEW CAMERAS —The land of the midnight cloudy—
Once again there is no turquoise and silver to see, as we gaze north. The northern camera shows less snow on the ice. I never expected that light snow-cover to last the way it has, however temperatures are hovering right around freezing and perhaps the thaw can now resume.  The southern view suggests to me some snow flakes are sticking to the camera lens. That would be surprising, considering the map shows high pressure. I am going to adopt a wait and see attitude. The camera produces a new picture every fifteen minutes or so.
  CRUNCHED CAMERA REPORT Our forlorn camera, its tripod legs sticking tragically skywards like a dead cow’s, drifted in aimless circles in light airs of 5 mph, and as little as 2 mph, moving north, south, west and east, and winding up slightly further west, at 84.666°N, 17.686°E. The big news is we finally made it above freezing, but not before spending most of the 24-hour-period as a complete failure, when it comes to thaw. We hit the period’s low of -2.1°C at 9:00 PM last night, were still at -0.4°C at 3:00 AM, but had achieved +0.4°C at 6:00 AM and had climbed to the giddy heights of +0.6°C as the 24-hour-period ended at 9:00 AM. However at least it is thawing somewhere. This year has been terribly disappointing, if you happen to get your thrills from watching ice melt. The pressure continued to rise, to 1015.4 mb.
JULY 29 —DMI Afternoon Maps—


There is some really interesting stuff going on in these maps, but duty calls elsewhere. I hope to get back to it later, but the short version is that there will be two polar storms in the next 96 hours. First “Stepperson” will be a modest 990 mb low between the Pole and Svalbard, and then part of “Gus” will be a second 983 mb low over the Pole. Lots of wind, lots of shifting ice, lots of action.
******
Here are a sequence of maps from the Jem model showing the solution that may happen (or may not). Basically, when “Gus” crashes into Norway, it splits, with half hanging back as an occluded North Atlantic low, but the other half, “Guszip,” kicked ahead along the arctic coast. This forms a string of lows, with “Stepperthree” forming in the Laptev Sea, however they then all combine into a single low over the Pole.


 (Click maps twice to fully enlarge)
Once this low achieves top-of-the-world status it just sits there all next week, according to models. If it happens I’ll watch how ice is shifted, during the set up, and then watch to see how much home-grown cold is created by the storm. Last summer the weakening of a storm over the arctic seemingly created temperatures down to minus seven, even though it was still officially “melt season.”
NEW CAMERAS —Cold comfort—
At least we are getting a little sunshine, though temperatures at both cameras remain just below freezing.
The northern camera looks a lot like April. The main difference is the yellow “cork” fell over, and the pressure ridges have lost their impressive shark-teeth points, and are rounded and shorter.

The southern camera shows just enough wan sunshine to give us a hint of a snow-bow. I reckon it is around 3:00 AM local time, with the midnight sun near its lowest highest point, (correction: 3:00 PM) and temperatures low as well. The melt-water pool to the lower right looked like it was thinking of thawing earlier, but decided against it.

THE GOVERNMENT AGREES WITH ME
The latest re-re-re-re-readjusted CFS V2 forecast for ice extent is out, and has completely backed off its forecast for above-average ice extent, at the September minimum. (Formerly it forecast a minimum 0.7 million km2 above average.) In fact it agrees with me, that the minimum will be 6.1 million km2. The government agrees with me? This must be a first.
 (click twice to fully enlarge)
JULY 30 —DMI Morning Maps—


“Art” is fading into Canada, “Stepperson” making its move towards the Pole, and “Gus” approaching Norway.
NEW CAMERAS —Some sunshine but no thawing yet—
The wind has picked up at our northern camera to over 15 mph. I thought the cold was due to an inversion, and wind would stir the air and warm the temperatures as “Stepperson” approaches. However so far the temperature remains just below freezing. The GPS shows the ice is starting to move, but so far the camera shows no signs of stressed ice.

Hey. That is the same picture as last night’s! Hmmm. I wonder what is up with our northern camera.
The southern camera is updated, and shows the snow has slumped over a melt-water rivulet, which forms a sort of crack in the snow at the top of the larger pool to the lower right of the picture. Winds have died down from over 25 mph two days ago to calm. The temperature is right at freezing. The conjunct army buoy Buoy 2013F: is up and running, and last reported a temperature of -1.27° C.

TEMPERATURES AT 85.91 N, 1.95 E
This is a graph of temperatures from Buoy 2014E: which is located roughly 80 miles north-northeast of our crunched camera. It shows the recent cold nicely.

NEW CAMERA —Midnight sun—
The northern camera is still refusing to update. The southern camera shows calm conditions and a drop of temperatures to around -4.0°. This is a picture a few hours after midnight, with the sun about as low as it gets. The camera is now just south of 77° latitude, and every midnight sees the sun closer to the horizon as the days get shorter further south.


CRUNCHED CAMERA REPORT
Winds have picked up slowly over our roving junkyard, from nearly calm yesterday to 25 mph at the end of our 24-hour-period, driving our camera steadily south as Stepperson approached from Siberia, but shifting from northeast to northwest to northeast to northwest, so our path was serpentine, achieving 17.557°E at 3:00 PM yesterday, 17.663°E at 9:00 PM, 17.587°E at 3:00 AM, and wound us up at 84.527°N, 17.711°E at the end of the period. The still puts us further east than we’ve ever been before, and keeps us in line to be the first North Pole Camera to ever head south on the east side of Svalbard.
Temperatures did not linger long above freezing, only managing it between 6:00 AM and some point after noon yesterday. The periods’s high was +0.6°C at the very start, and it dipped to zero by 3:00 AM and continued down to -1.0°C at midnight, then rose to -0.3°C at 6:00 AM, and then dipped to -0.5°C at 9:00 AM. With winds at 25 mph I couldn’t entertain the idea the air wasn’t mixed, and the milder air was overhead above an inversion. The wind is cold, and this is no way to run a thaw.
The barometer crested at 1015.4 mb at noon yesterday, and since then has fallen, at first slowly but now fairly rapidly, to 1004.0 mb.
JULY 30 —DMI AFTERNOON MAPS—


“Art” is fading away into Canada as “Stepperson” is a small, vigorous low being deflected to the Svalbard side of the Pole. “Gus” is bumping into Norway as forecast. Weak “Stepperthird” forming in Laptev Sea. Cold air remains wrapped around the Pole.
NEW CAMERAS —Important view missing—
O-buoy 9 is continuing to fail to update its pictures. It seems to be updating other weather information and GPS information, so I doubt Obama sent a drone over and blew it up for making him look like a fool. Hopefully it is some transmission glitch they can overcome. These cameras are designed to survive falling into open water and bobbing around like corks, as O-buoy 7 did last summer.
Winds are steady at 15 mph and the temperature is right at freezing. Buoy 2014E: at 85.68 N, 1.94 E (very roughly 300 miles towards Fram Strait), is coming in at -0.03° C.
Our southern camera has seen winds pick up to 10 mph and temperatures creep back up towards freezing, but there is no sign of thawing yet.

DMI EXTENT GRAPH —Before the storm—

HEY! WHAT HAPPENED OVERNIGHT?

I did not expect that uptick. I assume “Stepperson’s” wind is spreading ice south into the northern reaches of Greenland and Barents Sea.
JULY 31 —DMI Morning Maps—


“Stepperson” curving towards Svalbard as “Stepperthird” builds in Laptev Sea and “Gus” smushes against Norway like a ripe tomato.
QUICK GLANCE AT UK MET

I just wanted to see what “Gus” is up to. Like all storms this summer he is stalled and occluding, but sending energy over the top of Norway as “Guszip,” and developing a secondary south of Iceland, “Gusson.” A cold front is actually managing to press through the Baltic, but likely will turn around and start back as a warm front from Russia, once Gus weakens.
NEW CAMERAS –Still no thaw—
Our northern camera still isn’t transmitting pictures. Buoy 2014E: is reporting temperatures a hair below freezing at -0.03° C, however our camera’s graph looks like it has dipped down around -0.10°, with 15 mph winds.

Our southern camera continues cold, with its conjunct Buoy 2013F: reporting earlier a temperature of -0.51° C, but the camera itself showing dropping temperatures below 0.10° C as winds are around 12 mph. Still no signs of thaw, though some warm air has pushed north of Bering Strait, and Buoy 2014B: north of Being Strait 74.28 N, 171.41 W reports thaw at +1.41° C.


NORTHERN NEW CAMERA BACK IN BUSINESS.

CRUNCHED CAMERA REPORT
I apparently hexed the wreckage of our camera, when I suggested it might pass east of Svalbard, for that was as far east as it got. It promptly turned around and headed west all day, and south except for a single .001 degree northward blip at 6:00 AM, in winds that peaked in the range of 27 mph, before slacking to half that speed, and our junk heap wound up at 84.351°N, 16.661°E..
Our time period today was 27 hours, as we went back to getting our last report at noon. Once again we only managed to get above freezing for a brief 3-4 hour period, with a high temperature Of +0.2°C at 9:00 PM last night, before sinking to a low of -1.0°C at 9:00 AM, and then rebounding slightly to -0.6°C at noon. Heck of a way to run a thaw.
Our pressure bottomed out at 9:00 PM last night at 995.3mb, and since then has slowly risen to 1000.5mb.
JULY 31 —DMI Afternoon maps—


I don’t claim to understand the elongation of the lows into a sort of string of beads. Gus has devided into Gus and Guszip, as Stepperson and Stepperthree form another duo, and a new low in the East Siberian Sea, “Isib,” ends the string. Subfreezing temperatures are focused on opposing sides, north of Canada and in the Kara Sea, while areas of thaw concentrate in the other two opposing quarters,
NEW CAMERAS
Temperatures at our northern camera are right around freezing, and likely a little above, for some slight expansion of melt-water pools is apparent. The winds have stressed the ice enough to slightly widen the crack behind the yellow “Cork.”

Our southern camera has also seen temperatures rise to right around the freezing point, though likely here they are a hair below freezing, for no melting is obvious.

AUGUST 1 —DMI Morning Maps—


A long string of lows crosses the Pole now, from Norway to the Bering Stait, with the center forecast to become a polar low by tomorrow, incorperating “Stepperson”, “Stepperthird,” and “Guszip”, as the ends fly off and are absorbed south.
There is something fascinating and contrary about these polar lows. Everywhere else on Earth warm air rises and moves towards the Pole, as part of what is technically either a Hadley, Ferrel or Polar Cell. Once the air is risen, the Hadley cell recirculates it north and drops it as high pressure, such as the Azores High, while the Ferrel Cell recirculates it south (in theory) as the high pressures that follow storms, and the Polar Cell supposedly recirculates it north and drops it smack dab on the Pole as a polar high, which we have almost never seen this summer. Instead we have polar lows, with warm air rising right at the Pole, where it is impossible to flow north because you are as far north as you can get.
What goes up has to come down, but trying to get my mind around the dynamic has me a bit cross-eyed. The dynamic seems a sort of Polar anti-cell, but there’s a problem engineering an anti-cell. Having a high pressure on the Pole with a string of lows running around the cold-front periphery is more or less stable, but having a low on the Pole with a string of high pressures around the edge is unstable. Someone needs to inform Mother Nature it can’t be done, so She’ll stop messing with my brain.
One concept passing through my skull involves how a summer thundershower can cool a summer day twenty degrees, simply by bringing air up, condencing the moisture, and bringing it back down. (Why this doesn’t heat the air, like a Chinook coming down from a mountain range, is an interesting topic.) I’m watching to see if the current polar low cools the air like a summer shower.
Having so much low pressure strung out over the Pole seems like a sign some milder air has managed to get north, and we should see a little thawing. Let’s take a look.
NEW CAMERAS —Hints of a thaw?—
We are running out of time in the melt-season, but the northern camera shows temperatures around freezing, with the snow looking softened and the melt-water pools to the left back in a thawed state, though the pool to the lower right hasn’t reappeared yet. Further south, Buoy 2014E: is reporting + 0.15° C, which is a thaw, albeit not much of a thaw.
The crack behind the “cork” has closed, at least to the left.

Our southern Buoy is also right at freezing, with conjunct Buoy 2013F: reporting +0.13° C, which is warm enough to make the surface of our larger, frozen melt-water puddle look damp. At some point there must have been some light snow blowing about, for the melt-water rivulet at the top of that larger puddle has filled in again. That is a place I watch, to see activity.

CRUNCHED CAMERA REPORT
Apparently our mobile scrap heap decided it wanted to be like all the other buoys, and is heading west and south in a desperate attempt to be conventional, unaware it is too weird to ever fit in with the norm. It wound up at 84.255°N, 16.138°E. Winds slacked off below 10 mph for the middle of the period, but rose back to above 15 mph at the end.
Temperatures rose above freezing sometime between six and nine PM yesterday, and continued to slowly rise. The 24 hour period’s low was -0.6°C at noon yesterday, and the high was +0.5°C at noon today.
Pressures rose to 1001.1 mb at 6:00 PM yesterday before sliding back to 998.3 mb at noon.
AUGUST 1 —DMI AFTERNOON MAPS—


I’m watching with interest, as the next polar storm develops. The winds don’t look too bad, at this point, but the antics of temperatures will be worth taking notes about.
NEW CAMERAS
The northern camera shows the cloudy thaw is creeping along. The lower right corner shows hints of our meld melt-water puddle reappearing. However temperatures are less than a half degree above freezing

Our southern camera also has temperatures just a hair above freezing. Signs of thaw are very slight. Nearby buoys also are above freezing, but just barely.

AUGUST 2 —DMI MORNING MAPS—


At this point models suggest that, despite ingesting “Stepperthird” and “Guszip,”, “Stepperson” will not get all that intense, (only down around 995 mb), and will wobble away towards Severnaya Zemlya (the islands separating Kara Sea from Laptev Sea) around midweek. My main focus will be whether it has a cooling effect or not. It may spread some sea-ice south into the Kara Sea.
ICE EXTENT UPTICK

NEW CAMERAS —Slight freeze and a crack widens—
Our northern view shows signs of slight surface thawing, and or melt-water pool in the lower right corner has reappeared as the slightest spot. However don’t forget melting is occurring on the underside of the ice, and will continue until air temperatures drop at least to the freezing point of salt water (roughly -1.5° at this time of year) and likely until it gets below -5. The surface of the ice can be at -5° while only a few inches down the ice “remembers” the summer, and is at -1°.
The crack behind the yellow “cork” has reopened slightly. It appears to continue behind the pressure ridge to the central left margin of the picture.
Buoy 2014E: last reported a temperature right at zero, as the graph with this camera shows temperatures have dipped a hair below.


Our southern view also is witnessing signs of slight thawing, however it too has seen temperatures dip just below freezing. The conjunct Buoy 2013F: is still reporting +0.41° C, but the Army mass balance buoys are only updated twice a day. Likely having the winds drop to nearly calm and bits of blue sky appear above as the sun sinks towards its low-point at midnight is allowing some radiational cooling.


LEAD OPENING IN FRONT OF O-BUOY 9

When the ice starts to crack up and spread out like this, it actually increases the “extent.” The “extent” would only drop if the ice became so spread out that it created a situation where there was more than 85% water and less than 15% ice. Therefore “extent” graphs can create the illusion that ice is increasing when in fact it is simply more spread-out. So far this summer the ice has been less spread-out and more compacted than prior summers, but perhaps that is about to end.
Just as a rough guess I’d estimate 3-6 inches of ice is above water (not including the thicker pressure ridge). Assuming it is 4 inches, and remembering that 9/10th of an iceberg is under water, 36 inches of ice is submerged.
This is the sort of ice a gale can bash and smash and break into smaller pieces. It doesn’t look at this point as if “Stepperson” is going to be such a summer gale. In the summer of 2012 such a gale led to a lot of bergs melting, but last summer a similar gale led to ice being stirred about but not melting. This suggested to me that the water wasn’t as warm. It would be good to get a gale this August so we could be scientific and do a proper comparison, but Mother Nature doesn’t always give a fig about scientific procedure. The Creator created science, and she is it.
CRUNCHED CAMERA REPORT
Winds of 10-15 mph blew our dilapidated dump steadily south and west to 84.151°N, 15.798°E.
Temperatures remained just above freezing throughout the 21-hour-period, with the high +0.6°C at 3:00 PM yesterday, and the low +0.2°C at 9:00 AM today.
The barometer bottomed out at 997.7 mb at 6:00 PM yesterday and then rose to 1001.3 mb at 9:00 AM today.
AUGUST 2 —DMI Afternoon maps—


NEW CAMERAS
The lead has closed up, for the time being, at our northern camera. Temperatures have dipped below freezing.

At our southern camera temperatures remain a hair above freezing, and the slow thaw continues.

AUGUST 3 —DMI MORNING MAPS—


I confess to being a little disappointed by how weak “Stepperson” has turned out to be. I was hoping for a gale, so we could better compare this summer to last summer and the summer of 2012. However there does seem to be the swirl of subfreezing temperatures I was looking for. By midweek, however, it looks like the low pressure will sag to the Siberian side, and will work with high pressure to the Canadian side to create a Pacific to Atlantic flow, basically from Alaska to the Kara Sea. (That low over northern Canada, which I will call “Art” for the sake of continuity, is expected to wobble south to northern Hudson Bay.)
I am already looking for the next polar storm. Models did have one interesting solution, involving a small Baltic low moving up the west coast of Norway to the Pole, but that has vanished. Currently the future looks fairly wishy-washy up there.
POLAR TEMPERATURES AT LONG LAST ACHIEVE NORMALCY

Before I get too excited about seeing a thaw, I need to remember we saw this last year, and it was immediately followed by the graph dipping below freezing.
NEW CAMERAS —Thaw on hold—
As “Stepperson” drifts away we are seeing a dip in temperatures below freezing, despite the sun reappearing. The lead has closed, but we know it is lurking there. To the south Buoy 2014E: is reporting -0.43° C.


Our southern camera seemed to show better prospects of a thaw, as conjunct Buoy 2013F: reports + 0.02° C, however the graph attached to the camera shows a recent dip below freezing as well. (Perhaps the sun is just low at midnight.) The melt-water rivulet has yet to reappear at the top of the closest, biggest pool.


NEW CAMERAS —Thaw in hold of gripping chill—
I was a bit surprised to see the extent of the post-storm-chill at our northern camera today, despite the bright sunshine. Judging from the graph, we struggled from roughly -4.0° to -1.5°. Buoy 2014E: reported in at -1.93°C, and even down at our crunched camera temperatures got as low as -0.8°C. This no way to run a thaw, and I don’t expect to see any signs, and sure enough; the melt-water looks frozen over. (though the lead is cracking open again).


I assumed our southern camera was a safe distance from the polar low and would escape post-storm effects, but even it’s melt-water shows a skim of ice forming. Conjunct Buoy 2013F: reported in at -1.43° C. To the west-southwest Buoy 2014B: was reporting a slight thaw north of Bering Strait, at +0.15° C, but to the east-southeast Buoy 2014C: had dipped below freezing to -0.49° C.


The only decent thaw reported is on the north coast of Greenland, where Buoy 2014D: is reporting a toasty +3.00°C.
CRUNCHED CAMERA REPORT
Our shattered dream continued south and west until the very end of the period, where it reached 15.552°E at 6:00 AM and then started back east, ending at 84.103°N, 15.584°E. Winds were in the 5-10 mph range.
Temperatures were the surprise, for though we began and ended the 9:00-to-9:00 24-hour-period at +0.2°C, most of the time between was at zero or below, with reports of -0.8°C at both 9:00 PM and midnight.
I jump to the conclusion that this jolt of cold is a post-storm effect, (and not merely diurnal), however when I try to figure out the mechanism for such cold I wind up baffled. (At the Pole storms can’t draw cold from “up north” because there is no place further north than the Pole.) I’ve brought the topic into other discussions at other sites, trying to educate myself further, and have learned interesting things. However all in all I remain baffled, and merely observe without being able to explain.
AUGUST 3 —DMI Afternoon Maps—
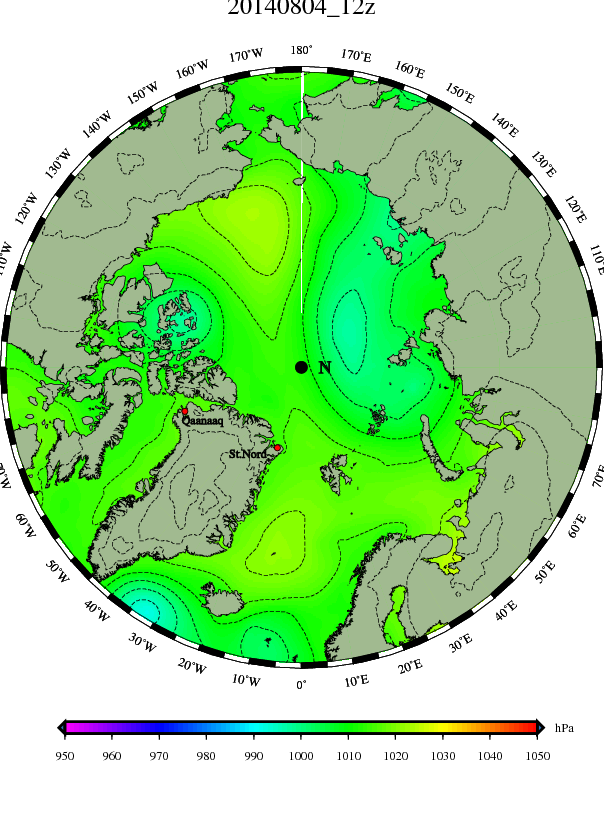
AUGUST 4 —DMI MORNING MAPS—
This morning’s maps have noon at the top, and can be contrasted with the maps just above, which have noon at the bottom. You can see the subfreezing temperatures vanish north of Canada as the sun gets higher. It may only be a degree or two of difference, but that is the difference between water and ice. Also, if you look back to August 1’s morning map, you’ll notice much more sub-freezing air now swirls around the Pole after the passage of “Stepperson,” which still sits north of Kara Sea in a weakened state.
The new players are high pressure areas which some call semi-permanent features, the Scandinavian High and the Beaufort High. I’ll dub these two manifestations “Scantoo” and “Beauf”. They are going to try to link up over the Pole, pushing “Art” down into Canada and “Stepperson” down into Siberia, though Stepperson may get reinforcements and fight back.
The fading memory of “Gus” has managed to bring fairly mild air up to Svalbard, but the west winds he pushed into Scandinavia have been met by the east winds and push-back of Scantoo. “Gusson” is down towards the Brutish Isles, “Gusthree” is over to the south east of Iceland, and the low after Guthree may well be Hurricane Bertha. All this Atlantic energy may well challenge Scantoo for ownership of Scandinavia, but not until next week.
QUICK GLANCE AT UK MET
This map shows we are back to having lows blocked in the Atlantic, as Scantoo rules Scandinavia. Over Scotland Gusson is attempting to kick a front into the Baltic, and it may get as far as southern Sweden before retreating.
NEW CAMERAS —The cold still holds—
The northern camera shows a frozen view with the lead cracked a little open, with nearly calm winds and temperatures down around -2.0° C. To the south towards Fram Strait
Buoy 2014E: is checking in at -1.87° C. No thaw to see here, folks; please move along.
Away towards our other south, our buoy towards Alaska is also cold and it appears to be snowing. Winds are around 10 mph, and conjunct
Buoy 2013F: reported in at -0.80 C. No thaw to see here either, folks. Everyone go home.
CRUNCHED CAMERA REPORT
Our under-insured multi-million dollar scrapheap went back to its conformist aim southwest towards Fram Strait, drifting along in 10-15 mph winds and winding up at 84.005°N, 15.342°E.
Once again the real news were the temperatures, which had struggled back to + 0.2°C at the very end of yesterday’s 24 hour period, at 9:00 AM. That was the high for today’s period as temperatures promptly dropped below freezing and remained there. They reached the low of -2.0°C only six hours later at 3:00 PM, struggled back to -0.6°C in the midnight sun, but the relapsed to -1.6°C at 9:00 AM today. Roughly 75 miles further northwest
Buoy 2014E: reported -1.27° C, and around 325 miles further north our northern camera was around -2.0° C. So basically the entire Atlantic side of the Pole was cold and not thawing. The warmth around Svalbard hadn’t made it north.
The pressure dipped slowly to 1004.6 mb yesterday evening, then rose slowly all day until the final report, when it jumped up to 1012.5 mb.
NEW CAMERAS
Our northern camera endured a cold day, with temperatures stuck below freezing. I checked in from time to time, and the sky alternated between a drab grey and a beautiful mackerel sky. The light winds began to pick up to 10 mph recently, and the ice may be shifting a bit. Besides the crack right behind our yellow cork, there may be another crack in the far distance, beyond the pressure ridge, and the crack in the pressure ridge itself may be becoming active.


The southern camera also saw some cold temperatures, especially towards midnight. There were some lovely views of the midnight sun as I peeked, each time I passed the computer. It is getting lower, down at 77 degrees latitude, as the days get shorter. The conjunct
Buoy 2013F: was reporting a chilly -2.98° C at that time, but as the sun has climbed towards noon north of Alaska the temperature graph attached to the carmera has shown temperatures fighting their way back to freezing. So we may still see some thawing. (Back in 1979 the thawing continued two weeks beyond the usual end.)
AUGUST 4 —DMI Afternoon Maps—
AUGUST 5 —DMI MORNING MAPS—
The evening and morning maps above show the diurnal swing of temperatures around the Pole like the hands of a clock. Sub-freezing temperatures continue to be associated with the filling remains of “Stepperson,” while across the Pole the filling remains of “Art” don’t yet show such chill, and seemed to draw mild air north through Baffin Bay to the Pole. At the very bottom of the maps the occluded remains of “Gusson” and “Gusthree” remain stalled and blocked in the Atlantic. The only building low pressure is east of the Laptev Sea, and may reinforse “Stepperson.”
The more interesting features are the high pressure systems. Besides “Scantoo” over the Baltic and “Beauf” towards Alaska, “Gren” is building between Greenland and Svalbard. The will form an area of ridging across the Pole.
“Scantoo” is interesting, for the same situation that makes Scandinavia lovely in the summer bring bone-chilling blasts in the winter. Siberia has the greatest swings of temperature in the northern hemisphere, between -50 and +40 Celsius, (-60 and +100 Fahrenheit,) and the same east winds that allow Scandinavian beauties to wear next to nothing in the summer makes them hide in muffling layers in the winter. Therefore, if one wants to spoil beautiful weather with worry, one can worry this summer’s pattern is hinting at next winter’s pattern. A winter of east winds would be very unlike last winter’s southwest flow.
When summer patterns hint at winter patterns there is usually a period of transition, which gives one the sense the pattern has changed when it hasn’t. In the USA a cold summer often has a delightful, warm autumn before the cold returns with winter’s teeth. I’m not sure the same thing happens in northeast Europe, but I’m keeping an eye out for it.
One thing I’m watching for is hinted at by the weak low pressure separating “Scantoo” from “Gren.” When lows can’t get through the blocking Scandinavian High they tend to be squeezed south through Spain, and also to come leaking over the top. It is the northern track that hints at a transitional storm track that appears along the Siberian coast in the fall. The air gets cold over the ice to the north, and the mainland to the south, and the area of open water along the Siberian coast becomes a strip of warmth and moisture storms like to run along.
In any case these are things I’m watching for.
ARCTIC TEMPERATURES DIP
I was expecting this as an after-effect of “Stepperson”, though I am still unsure how it comes about. Now, with high pressure replacing the low, there will likely be a bounce back. However we are rapidly approaching our final chance to see decent thawing, and nearing the period when all the melting comes from beneath the ice.

(click to enlarge)
ICE EXTENT TAKES A DIVE

(click to enlarge)
The current dip in the graph demonstrates how little the graph responds to air temperatures. Largely it responds to winds and the melt of ice from below. “Stepperson” failed to blow ice into the Laptev Sea, and ice also has been shifted away from the coast of Alaska. The uptick in the PDO does seem to be allowing warmer water in through Bering Strait, however the down-tick of the AMO allows ice on the the north coast of Svalbard, where there wasn’t ice during the depths of the past winter.
I’m expecting this graph to soon level off. We’ll see.
NEW CAMERAS —cold relenting—
Temperatures have eased up towards freezing at our northern Camera. Winds have picked up to 18 mph and the ice is showing signs of movement at the pressure ridge. Towards Fram Strait,
Buoy 2014E: reported a rise to -0.30° C.
Our southern camera is also showing signs of thaw. The conjunct
Buoy 2013F: reported +0.32 C. However southwest towards Being Strait
Buoy 2014B: showed a surprising cold -1.04 C, and to the east
Buoy 2014C: came in at a chilly -2.44 C. So some cold air is still around.
CRUNCHED CAMERA REPORT
Our former provider of vistas crossed 84 degrees latitude (which it had such a hard time staying across last year) and continued steadily south, but its westward progress stopped at 3:00 yesterday afternoon at 15.318°E, and we headed southeast to end at 83.929°N, 15.827°E at 9:00 AM today. It is a pity the camera doesn’t work, for if it did we might see the mountains of Svalbard at some point before the winter darkness falls.
Temperatures, which had spent most of two days below freezing, rose from a low of -1.6°C at the start of our 24-hour-period, edged above freezing at midnight, and reached the high of +0.5°C at 6:00 AM, before slumping back slightly to +0.2°C at 9:00 AM.
The winds picked up from around 9 mph to 15 mph, as the pressure crested at 1014.4 mb at 6:00 PM yesterday and then slid down to 1010.6 mb at 9:00 AM. As with a mid-latitude high pressure cell, as pressures started to fall temperatures started rise.
NEW CAMERAS —Contrasting views—
Our northern camera has the sort of turquoise and silver view I originally turned to the North Pole camera to see, back before politics spoiled the formerly safe topic of weather. There is a fog bow to the left, which indicates we have slipped below freezing after a period of thaw. The landscape beyond the pressure ridge has shifted to the left, as winds stiffened to 18 mph for a while, but now they are dropping off towards nearly calm conditions, and with clear skies temperatures may dip as radiational cooling occurs, with the sun so low. The shadows are getting longer, because, alas, summer doesn’t last forever.
I think that, despite the thaw, some wet snow fell when I wasn’t watching. Also the yellow “cork” is standing up straighter, though don’t ask me why. Judging from the shadows, my best guess is that we are looking northeast, towards the North Pole, which is only 120 miles away, slightly right of the center horizon.
Also judging from the shadows, a small robot stands atop our camera with a hammer in one hand and a snow stake in the other. It is good to see our tax dollars working so hard.
Our southern camera has no turquoise and no silver. It is just the gray grayness we’ve seen far too much of this summer. Thawing is underway, and though the temperatures are just above freezing at two meters above the ice, they are likely warmer five meters up. A snow-eater fog is adding to the melt. Conjunct
Buoy 2013F: was reporting +0.21 C, but the fog releases latent heat when it condenses on the ice, and you get more thawing than you’d imagine was possible from two-tenths of a degree.
Earlier, when I peeked in passing, I noticed the melt-water rivulet had reappeared between the large pool in the right foreground and the smaller pool in the central distance to the right of the yellow robot. Now that rivulet has vanished, but this time it is not due to cold. I think the water of our pool has found a new exit, and the level of the pool in the right foreground has lowered.
 AUGUST 5 —DMI Afternoon Maps—
AUGUST 6 —DMI Morning Maps—
No time to write.
NEW CAMERAS
Northern camera cold again.
Buoy 2014E: at -1.63 C
Southern Buoy thaw ending?. Conjunct
Buoy 2013F: at +0.21 C but may not have updated. Graph attached to camera shows dip below freezing. Wet lens. Can’t tell if it is snow or rain.
LUNCHTIME PEEK AT SOUTHERN CAMERA
CRUNCHED CAMERA REPORT
The ice our lost opportunity floats with continued resolutely south towards Svalbard, but the longitudinal motion again switched, achieving 16.050°E at 9:00 PM yesterday and then heading back west, winding up at 83.812°N, 15.878°E at the end of our 24-hour-period, at 9:00 AM today.
With winds from the north our latest attempt to thaw again was short lived. Our high temperature of +0.2°C was once again at the very start of our period, and once again we spent most of the entire period below freezing, bottoming out at -1.3°C at midnight, bouncing back to -0.4°C at 6:00 AM, and then sagging slightly to -0.6°C at 9:00 AM. Need I say it? (“Heck of a way to run a thaw.”)
Winds were brisk much of the period, a little over 15 mph, but slowed to under 7 mph at the end. The pressure steadily rose to 1017.6 mb.
AUGUST 6 —DMI Afternoon Maps—
The low “Stepperson” has been repressed into the Kara Sea as briefly the high “Beauf” has conquered the Pole. Briefly we have a textbook polar cell. However the low in the east of the Laptev Sea (“Stepperfour”) is likely to be slung right across the pole to Greenland, so “Beauf’s” victory is likely to be short lived.
Over Scandinavia “Scantoo” is not hanging as tough as high pressure did earlier in the summer, and low pressure looks likely to make inroads both along the northern, arctic coast of Scandinavia, and in the Baltic Sea.
While the isobars suggest a flow from Bering Strait to the Pole, little warmth seems to be coming north on it.
QUICK GLANCE AT UK MET
The map looks a lot like the summer’s blocks, with the occluded remains of Gusson and Gusthree blocked by Scantoo, however the Atlantic front has pushed further east into the Baltic than it could manage in the summer. An interesting feature to watch is that little ripple of low pressure crossing under the block to the lower left of the map. Some models are showing this ripple heading east nearly to Spain, and then taking a sharp left up the English Channel into the North Sea, not as an autumn gale, but as a hint summer can’t last forever.
NEW CAMERAS —Gray and cold—
The outlook for thaw is rather bleak at the northern camera. Fresh snow seems to have dusted the few signs of melt we had, and the attached temperature graph is down near -5.0°C . To the south
Buoy 2014E: reported -4.31° C (I think at 1200z). Winds have slacked off and the ice in the closest pressure ridge looks less active.
Our southern view at least has some water rippling in the increasing 13 mph wind, though it looks suspiciously like it is freezing around the edges. But perhaps the outlet will freeze and the pool can get deeper again. The conjunct
Buoy 2013F: last reported -0.17° C, and the graph attached to the camera looks a hair below freezing as well, (and a hair makes all the difference between melting and freezing.)
SHOCKING NORMALCY
This latest uptick in the extent graph brings us close to normal. (The gray line.) What is the big deal about being normal?
AUGUST 7 —DMI Morning Maps—
The high pressure “Beauf”, and the Pacific-to-Atlantic flow between Beauf and the retreating “Stepperson” and advancing “Stepperfour” on the Siberian coast, is the main feature of these maps. You can see some milder air being drawn towards the Pole from Bering Strait, and even a little pocket of +5° air moving north. The clash between that milder air and colder air will fuel “Stepperfour’s” growth and advance. As Stepperfour pushes Beauf back towards Alaska, Beauf’s clockwise flow likely will drag the cold air from the Atlantic side of the Pole along the coasts of Greenland and Canada, and back to Alaska.
“Scantoo” looks weak over Scandinavia, and will not defend them from Atlantic influences. Warm air has made it into Barents Sea, but looks likely to retreat. There is warm air in the east and west of Eurasia, but cold air in the middle, as this Dr. Ryan Maue map from Weatherbell shows:

(click twice to fully enlarge)
The concentration of cold around the Pole has led to another down-tick in the DMI temperature graph. The current invasion of milder air from the Pacific may represent our last chance for a decent thaw. It will be interesting to watch Stepperfour, and see if it uplifts that mild air and turns it into post-storm cooling.

(click to enlarge)
NEW CAMERAS —Last chance for thaw?—
The northern view is most definitely bone-chilling. The temperature graph is even colder than last night, down near -6.0 . It is interesting to note this cold is entirely home grown, and it grew despite the fact the sun never sets. Winds remain light, around 5 mph, and in the past half hour clear skies have faded. I think rather than high clouds a sort of ice-fog is forming.
Our southern view is spoiled by what I think is frost on the lens. (The old North Pole Camera had a fish-eye lens that was better at allowing you to figure out what was spoiling the view.) The camera seems to be in a small pocket of sub-freezing temperatures, and the milder air moving up from the Pacific hasn’t reached it yet. (The Army buoys still seem to have yesterday’s temperatures, but they show this buoy as the only buoy in the area below freezing.)
NEW CAMERAS —Now this is more like it—
I’m busy today, but when I saw these views as I passed my computer I figured I just had to share them. The northern view shows the ice-fog moving off, and dazzling sunshine. Temperatures are still cold.
The southern view also shows sunshine, as the lens melts clean of what apparently was snow, as a fresh snow-cover blankets the scene. Under the clear sky, with the sun near its midnight low, temperatures have dropped to around one below zero. As the sun gets higher the snow could make some nice melt-water for some decent pools. However, for people who stress “albedo,” the fresh snow is reflecting away a lot of heat.
Average ice thickness highest in five years
I lifted the above graph from Neven’s “Arctic Sea Ice Blog”, which seems a fairly good site, as long as you can overlook an Alarmist bias. I don’t mind bias, being biased myself, as long as one doesn’t “adjust” facts. And so far the site hasn’t struck me as one that ignores reality. It is at neven1.typepad.com/blog/
The graph shows the ice is returning to the levels it was at before the “death spiral” got so much press. I think it is largely due to a blip in the AMO towards the “cold” phase. If we blip back towards the “warm” phase maybe we can get back to watching ice melt, for a few more years, before it shifts to the “cold” phase for a longer 20-30 year stay.
Interestingly the PSO shifted to its “cold” phase a few years ago, and ice started increasing in the Bering Straits, however it is going through a “warm” blip as the Atlantic blips cold, and there is more melt on the Pacific side. It likely will shift back to cold soon, as the “warm pool” southeast of Alaska shows signs of wearing thin.
When both the AMO and PDO are in their “cold” phases we’ll see some major growth in sea-ice, or so I think. And what does all this have to do with CO2? Absolutely nothing. And that is the joke being played on humanity.
CRUNCHED CAMERA REPORT
Our litterbug’s dream continued south and west to 83.808°N, 15.354°E on a light northerly breeze of around 10 mph, as temperatures plunged to levels that freeze salt water. Because the melting ice is close to being fresh water, the water at the surface freezes at a higher temperature than most ocean water (unless you include the northeastern parts of the Baltic Sea, that are practically fresh,) so sea ice can start to form when temperatures are as high as -1.5°C. During this 24-hour-period we began at -0.6°C at 9:00 AM yesterday, but had sunk to -1.6°C by 3:00 PM and -2.4°C at 6:00 PM, and remained below the freezing point of salt water to the end of our period at 9:00 AM, when temperatures were at the day’s low of -3.4°C. This is no way to run a thaw.
AUGUST 7 —DMI AFTERNOON MAPS—
The high pressure “Beauf” has been backed off the Pole as “Stepperfour” advances from the Laptev Sea. It looks like he (or she?) is bringing a glob of warm air along, to dent the surprising area of subfreezing air that has grown over the Pole. Such warm air is like the gasoline that fuels these polar lows, and when it runs out they weaken.
I’ve been doing a lot of thinking about how these lows might create the post-storm cold spells that seem to follow a storms demise. So far I have no answer.
It still looks nice and warm in Scandinavia, but the blocking high “Scantoo” has backed off, and left the area more open to Atlantic invasions than it has been all summer. Judging from afar, they have had a nice one, unless it was too hot for them. Perhaps someone from that area can inform me what its been like.
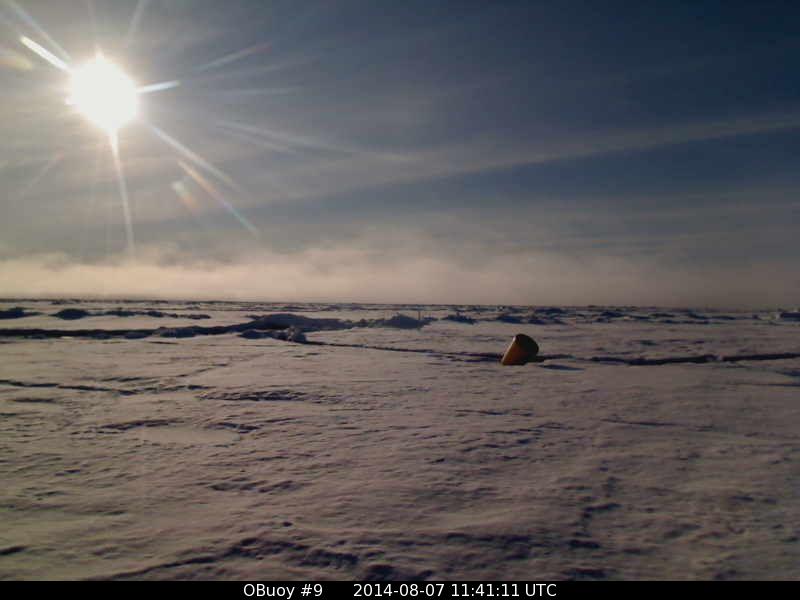
NEW CAMERAS —Last chance for thaw?—
Both our cameras have shown a recovery from the startling chill of earlier today. Our northern camera has likely had the cold shunted south towards Svalbard, Greenland and the Canadian Archipelago (its amazing how many directions are “south” up there) as “Stepperfour” brings warmer air. The wind has picked up from nearly calm to around 10 mph, and it looks like the lead behind the yellow “cork” is opening up again.
Our southern camera shows the fresh snow already looking slushy and the largest melt-water pool refilled, with the melt-water rivulet at its top again apparent. The water level may drop abruptly, as it did a couple days ago, as it had some sort of unseen outlet, (perhaps off-camera), which may have filled with slush and frozen, When that plug melts the draining may resume.
On the other hand, because the winds have slacked off and are a light air of 5 mph, if the skies stay this clear we could see radiational cooling when the sun sinks down near the horizon at midnight. Even though the sun doesn’t actually set, it can get cold enough to see some refreezing.
AUGUST 8 MORNING DMI MAPS


RE-RE-RE-RE-RE-READJUSTED CVS V2 FORECAST
This model is now predicting a September minimum of 6 million km2, down from an earlier prediction of over 7 million, and sees that minimum as being 0.3 km2 below “normal,” where before it was saying the minimum would be more than 0.6 above “normal.” This is a clear demonstration of how badly models do predicting things more than ten days away, in the future. (I’ll take the brains of Joseph D’Aleo and Joe Bastardi at WeatherBELL over a computer any day.) (The CFS V2 model was also predicting we’d have a super El Nino by now, last spring, as I recall.)
I’m sticking with my prediction of a minimum extent of 6.1 million km2, though that may be too high. I am counting on the packed up ice being spread out, which hasn’t been happening.
NEW CAMERAS
Our northern camera is seeing our best thawing in a while, with temperatures nudging above freezing, a steady wind of 10-15 mph, and the ice in the background becoming active again. It is likely colder at our crunched camera than up here near the Pole, and
Buoy 2014E: at 84.79 N,1.70 E is coming in at + 0.05° C, which is colder than the vista our camera is looking across.
Of especial interest to me is the movement of bergs along the the more distant pressure ridges, along the horizon. If this solid sheet of ice breaks into separate floes it could increase “extent” (though not “area”) and make my prediction of 6.1 million km2 at the minimum look less dunderheaded. (And looking less dunderheaded has always been a goal of mine.)

Our southern view has gotten cold again, as the sun sinks towards the horizon at midnight, without ever setting. When the sun gets very low a glassy patch of open water actually reflects more incoming radiation than the ice and snow, because the ice and snow has all sorts of bumps and nooks that catch light like the faces of mini-cliffs. However our conjunct
Buoy 2013F: was reporting -2.22 C,
Buoy 2014B: north of the Bering Straits was reporting -1.69 C, and
Buoy 2014C: to our east-southeast was reporting -1.24 C.
Even before the midnight sun sets you start to get a skim of ice on your water bucket, during the “night,” and I recall a commentator who was stationed up there describing how the sight of that skim of ice made you hurry to finish your summertime jobs.
Melt-water reflecting incoming radiation (and being beautiful about it)
CRUNCHED CAMERA REPORT
Our seeing-eye-dog weather station, dragging our poor, blinded camera face-first across northern wastes, yelped joyfully southward as north winds brought milder air right over the top of the Earth. As a sort of warm front passed and winds freshened to 20 mph, our westward motion ceased at 15.275°E at 3:00 PM yesterday, and we finished at 83.682°N, 15.580°E.
Temperatures rose steadily from -3.4°C at 9:00 AM yesterday, getting above freezing after midnight and ending the 24-hour-period at +0.4°C, at 9:00 AM today.
Pressures, which had crested at a high 1025.4 mb at 6:00 AM yesterday, sank steadily to 1015.8 mb at 6:00 AM today, before rebounding slightly to 1016.8 mb.
AUGUST 9 —DMI Morning Maps—
(Sorry about missing last night’s maps, but sometimes you have to put family before ice.)
“Stepperfour” is weakening as it swings across the Pole towards a revived “Art” in northernmost Hudson Bay. (Yes, I understand it is a stretch to call that feature “Art,” but there is a faint connection, and it is fun to trace the connections all the way back to “Art’s” origins as Hurricane Arthur whacking Cape Hatteras weeks ago.) With Steppenfour moving across the Pole so swiftly I’m wondering if the post-storm cooling might move across as well; there is little doubt it did bring warming across the Pole.
Now my eyes turn to the evolution of “Steppenwolf” from the remains of Stepperson down in Siberia south of the Kara Sea. If you can animate some models there is a sort of Tarzan swinging over Scandinavia that is fun to watch, even if it is merely a figment of model-imagination.
The models see two lows moving up the English Channel into the North Sea, the second of which holds memories of Hurricane Bertha. Although they both get sucked back into the North Atlantic occlusion, that is like Tarzan’s right arm holding the last tree, and Tarzan’s left arm is represented by low pressure getting up and over Norway, and then swooping down into Barents Sea. Then that low occludes and gets stuck, but the process repeats, as yet another low Tarzans ahead, and swoops down and then up into the Kara Sea. It is that low swinging up into the Kara Sea that gives Steppenwolf the power to push up towards the Pole, next weekend. (Unless, as I suggested, this is all a figment of a model’s imagination.)
The high pressure “Beauf” dominates the Pacific side of the Pole, but on its other side a Pacific low is crashing into Alaska, and should be watched. (Call that low “Ska.”)
NEW CAMERAS —Thawing—
The temperature graph attached to our northern camera shows temperatures flirting with freezing, bouncing to either side, as
Buoy 2014E: last reported +0.03° C and our crunched camera reported +0.40°C. Briefly, at least, we are seeing a thaw, although I expect to see refreezing in the wake of “Stepperfour”. Winds remain brisk, between 13 and 18 mph, and while this is not a gale it can shift the ice around. Unfortunately light fog is obscuring our view of the more distant pressure ridges. There is currently no movement of the near pressure ridge and lead. (What I like to do is save pictures from close intervals on separate tabs, and then click back and forth between the tabs, which allows any changes to appear as slight jumps in an otherwise frozen scene. You do have to be careful not to be fooled by moving shadows when the sun is out.)

Our southern camera shows very little change from yesterday. There is a slight change in the skim of ice around the edges of the big pool; either it melted a little or the water rose a half inch.
The view we witness has been going through diurnal swings of temperature under beautiful blue skies. The days show warming, and the last report from conjunct
Buoy 2013F: had temperatures up at +0.80 C. I think that is a 0000z update, which is early afternoon over our southern camera. All nearby buoys are also above freezing, with
Buoy 2014B: at +0.23 C and
Buoy 2014C: at +0.35 C. Again, I think these are 0000z updates, and represent the “heat of the day”. Our picture shows a later time, with the chill of the midnight sun growing, and indeed the temperature graph shows a dip towards frost.


It looks like the midnight-sun-chill will not be as strong today, though the winds remain light, and perhaps we will see more thawing as the sun rises higher. We are on the south side of the high pressure “Beauf” in our southern view, and there is a chance warmth may work north from Alaska, though also a chance Beauf will circulate cold air around from the Pole. I don’t expect the sunshine to last, especially as the Pacific storm “Ska” nudges into Beauf from the south.
HUDSON BAY STILL HAS ICE
I din’t much like this, because a warm Hudson Bay protects my corner of the Planet from arctic blasts, early in the winter. If it stays cold it is likely to freeze over faster, and that makes it more possible for the cruelest arctic invasions, (straight down from the north and evading the warming of the Great Lakes), to hit us earlier in the winter. (In New Hampshire the old-timers called such blasts, “The Montreal Express.”)
By the way, I lifted this nice overlay of two Canadian Ice Service maps from an interesting site, focusing on polar bears and their habitat, you can see here: polarbearscience.com
CRUNCHED CAMERA REPORT
Our dismantled technology, solar array still collecting, and dispensing occasional jolts, causing passing puffins to leap into the air with loud squawks of consternation, drifted steadily south and east in winds that ranged between ten and twenty mph, winding up at 83.546°N, 16.299°E.
Temperatures stayed stable and just above freezing, sinking to a low of +0.2°C at 6:00 PM yesterday, and rising to a high of +0.6°C at 9:00 AM today.
Pressures sank to 1009.1 mb at 3:00 AM and then rose back to 1010.3 mb at 9:00 AM.
AUGUST 9 —DMI Afternoon Maps—
Stepperfour much weaker. High pressure building over Svalbard. Tomorrow will tell, in terms of post-storm home-grown cold.
NEW CAMERAS —Changing weather—
Our northern camera shows mild temperatures as Stepperfour passes, with winds remaining around 15 mph and temperatures apparently mild, roughly +1.00° judging from the graph, while south of Stepperfour
Buoy 2014E: reported -0.32° C even as our crunched camera reported +0.60°C. Winds are likely swirling about. There is less movement of the ice in our picture than I expected.
Our southern camera experienced a cold night, with conjunct
Buoy 2013F: reporting -1.59° C. The diurnal swing also appeared in
Buoy 2014B: to the west, at -0.58° C, and in
Buoy 2014C: to the east, at -1.72° C. All three were above freezing when I looked this morning.
Since these Army mass balance buoy reports it looks like winds at our southern camera have risen swiftly from near calm to 15 mph, the temperature of the stirred air has risen to near freezing, and our lying eyes can see the turquoise and silver is gone, and gray skies are back. The weather; it is a-changing.
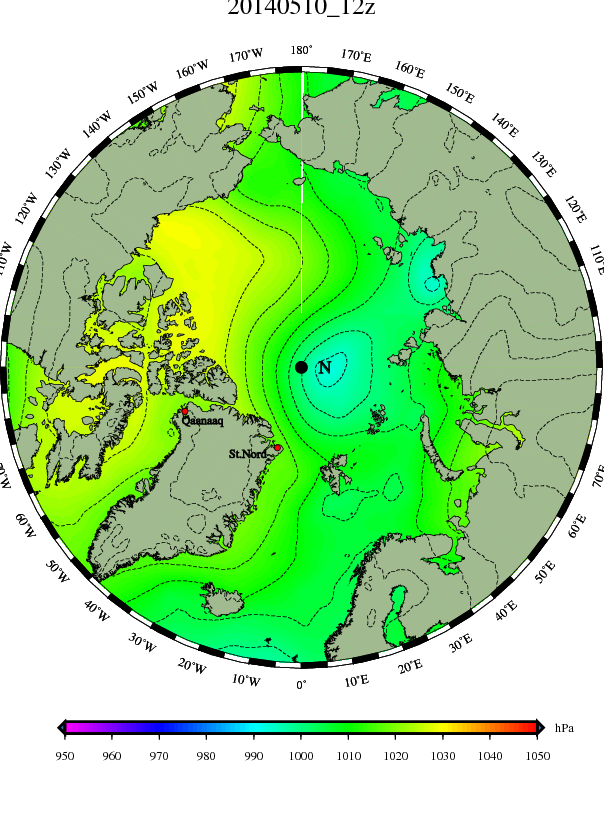
AUGUST 10 —DMI MORNING MAPS—
“Stepperfour” has faded across the Pole into “Art” at the top of Baffin Bay, and together they will head down the bay towards the south tip of Greenland. On the wake of Stepperfour is subfreezing air, and I suspect the next map will show a colder Pole. Back on the other side of the Pole the remains of “Stepperson” lurk south of the Kara Sea and are beginning the genesis of “Steppenwolf,” which will move towards the Pole because the high pressure systems on the Pacific and Atlantic sides are too gutless to stand atop the earth and obey the textbooks, and be a proper Polar Cell. (If Steppenwolf does develop, it will be positioned to blow a lot of ice into the Kara and Barents Sea, and eventually into Fram Strait, which could lead to an uptick in the “extent” graphs, however I must confess I don’t trust the models. They are not all that good when it comes to handling unusual stuff.)
The big event is in the north Atlantic, where the dullard “Gusthree” is being replaced by a North Sea low, (“Preberth”,) which then will be replaced by “Bertha,” who looks to become rather vigorous for August (975 mb) and furthermore able to occlude right off Norway, creating an underneath-storm-track able to shoot lows into the Baltic Sea, and transform Scandinavia’s weather.
QUICK GLANCE AT THE UK MET
The purpose of these maps is to show the remains of hurricane Bertha swinging up over England as a North Atlantic low, becoming a North Sea low and developing some gale force winds, and then occluding off Norway. The top map shows the current situation, the middle map shows the situation in 24 hours, and the bottom map shows the situation in 48 hours. Notice the surge into the Baltic, and also the remains of “Preberth” Tarzaning over the top of Norway.

(Click these maps to enlarge them)
NEW CAMERAS
Our northern camera shows little happened during our period of thawing. The melt-water pools are no bigger, and the bit of a melt-water pool we saw earlier in the summer in the right foreground never reappeared. Temperatures dipped below freezing around 0000z but have recovered to around zero.
Buoy 2014E: reported in at -1.31 C at 0000z. I confess I didn’t expect the temperatures to recover, and still expect them to show a post-storm decline. Winds have slacked off to 5-10 mph. Though the near pressure ridge looks reletively unchanged, the jumble of ice towards the horizon looks different, now that the fog is gone.
Our southern camera has been through a very cold night I wasn’t expecting. The conjunct
Buoy 2013F: came in at -3.37 C, and to the east
Buoy 2014C: also came in at a chilly -3.91 C, however to the west
Buoy 2014B: north of Bering Strait was coming in at more modest -0.19 C. I suppose that is where the milder air I was expecting is hiding.
The temperature graph attached to the camera doesn’t yet show any daytime rise and, though winds are down around 5 mph, I think the reason our melt-water pool looks so glassy is because it has frozen over.
NEW CAMERA —A NORTHERN CAMERA PICTURE TO COMPARE WITH—
By opening this picture and the above picture (from 20 minutes earlier) onto new tabs, and then switching back and forth between the two tabs, I am able to discern changes, and see if the more distant ice is moving. Currently it isn’t, though the most distant bergs are appearing out of a haze.
CRUNCHED CAMERA REPORT
Our lost vision of beauty and wonder drifted on, primarily to the east with southward progress slowing, in winds diminishing from 15 to 10 mph, winding up at 83.523°N, 17.305°E.
Thaw continued, with temperatures fairly stable, dropping from +0.6°C at 9:00 AM yesterday, briefly touching zero at 9:00 PM, and then rising to +0.5°C at 9:00 AM today.
Pressures also remained fairly flat, dropping to 1010.0 mb at 9:00 PM yesterday before rising to 1010.8 mb at 9:00 AM today.
The satellite shows the ice remains pulverized but packed around our hulk. Svalbard lies to our south, with its north cape at roughly latitude 80 and its west coast at roughly longitude 11.
AUGUST 11 —DMI MORNING MAPS—
I didn’t get around to posting last night, as I was fishing on a lake with my grandson as the sun went down. We have a family reunion at a campground at this time every summer, and I sneak in these posts when I hustle home to feed goats, pigs, chickens and a rabbit. (One of these days I’ll be rich and a farm hand will do all that stuff.)
“Steppenwolf” is not waiting for a piece of “Bertha” to come Tarzaning over the top of Norway, and instead is pushing towards the Pole without reinforcements. Judging from its isobars, it could spread ice out a bit in the north of Barents and Kara Seas.
As I expected there is some cold air in the wake of Stepperfour’s cross-polar jaunt. I think there would be more cold air if it stalled on the Pole and filled there. It now has been absorbed into “Art” and they in turn are being absorbed into another storm down in northern Hudson Bay.
The warmest air of the summer has moved into Bering Strait, but seems unlikely to invade northward. Subfreezing air has been swung down to Alaska’s coast by the high pressure “Beauf,” even as milder air has been swung around north of there.
NEW CAMERAS —Awaiting developments—
Although temperatures at our crunched camera last came in at +0.50°C, and
Buoy 2014E: came in at +0.39° C three hours later, this camera views a world 400 miles further north, only two degrees from the Pole on the Canadian side, and temperatures are graphed below freezing for the past 12 hours, and currently look to be at -2.00°.
It is getting late. Summer is slipping away, and I’m staring to think we won’t see a decent melt-water pool this year. The best chance for action will kikely be a big storm, which could crack up the ice. It has looked like it has been trying to crack up, but simply has no room to spread out.
Our southern camera has more hope of seeing thawing, especially as some fairly mild air lies not far away, down in Bering Strait. We did rebound from yesterday’s unexpected cold, and conjunct
Buoy 2013F: reported we made it to +0.23 C°, though since then the graph shows we recently dipped swiftly down to roughly -1.00°. Our larger melt-water pool looks like the skim of ice melted, and hasn’t yet refrozen. Winds are light and variable.
Our conjunct buoy was the lone thawing report. West towards Bering Strait
Buoy 2014B: reported -1.06 C ° at the same time, while to the east
Buoy 2014C: reported -0.08 C°.
Models show the high pressure “Beauf” that is over this camera eventually shifts east along the Canadian arctic coast. I suppose the question then becomes, can it draw milder Pacific air north in its wake. We are running out of time for thawing at this camera as well.
CRUNCHED CAMERA REPORT
In winds that continued to slacken, and that at times were calm, our hunk of mayhem and carnage continued slowly east, leaving a serpentine wake, moving south, north, south, north and south again, and ending .003° further north than it began, at 83.529°N, 17.796°E.
Temperatures bounced about, beginning at +0.5°C at 9:00 AM yesterday, but immediately sinking to -0.7°C at noon, and reaching the days low at -1.2°C at 6:00 PM. Then, making a mockery of diurnal variation, temperatures rose and snuck above freezing briefly at +0.2°C at midnight, before sinking to a second low of -0.9°C at 6:00 AM, before bouncing back to -0.2°C as the 24-hour-period ended at 9:00 AM.
When considering this sort of yo-yo-ing temperature antics, it helps to remember the sea-water is below freezing, often lower than -1.0°. When winds get slight pools of air form, some water-cooled, and some sun-warmed, and they waft about contending for space. Often the cool air wins simply because it is colder and sinks. The air may be milder only fifty feet up.
Pressures continued steady, bottoming out at 6:00 PM yesterday at 1009.3 mb, but ending the period only 0.3 mb higher than we began at 1011.1 mb.
AUGUST 11 —DMI Afternoon Maps—
I haven’t had time to look at the models. I see “Steppenwolf” looks healthy, on the coast of the Kara Sea, and I suppose that is “Bertha” at the bottom of the map off Norway. I didn’t expect to see that micro-low off the northeast coast of Greenland. Hmm. As I recall, the high pressure “Beauf” was suppose to be sliding in that general direction. Mischief afoot?
Midnight is at the top of the map, so I expect the sub-freezing temperatures up that way. I actually was expecting more cold between Greenland and the Kara Sea, in the wake of “Stepperfour,” than I see. I also thought it might be a little colder over Scandinavia.
However, all in all, I approve of the current situation. Surely the Creator of this amazing planet will take solace in that, as most people don’t seem to thank Him for much of anything.
However I do not approve of the end of my brief vacation, camping.
NEW CAMERA —Surprising Mildness—
I highly recommend the Army mass-balance site at imb.crrel.usace.army.mil/newsata.htm , as it gives actual data from actual buoys. My chief complaint is that it only reports at 0000z and 1200z, as best I can tell. Therefore data may be hours out of date. However it does give you a glimpse you would otherwise lack.
Currently our northern camera reports temperatures are dipping below freezing, but
Buoy 2014E: reports it was +0.16° C at 1200z (I assume; they don’t have a time-stamp,) even as our crunched camera was reporting colder temperatures further south three hours earlier. You put all this current and outdated data in the hopper of the brain and blend it, and the current picture makes more sense. It looks slushy, as if it was recently thawing, but the thaw is over for the moment. Winds are nearly calm, as we sit in a col between two high pressures and two low pressures. It is gray, showing air masses are meeting and mixing.
Our southern camera sees thawing, with conjunct
Buoy 2013F: reporting +0.87° C, which is normal for an ordinary melt-season, but unusual for this stunted summer.
In fact five out of the six mass-balance Army buoys, five show thaw, which is typical for melt-season, but the sixth is the last one I’d expect to show subfreezing temperatures,
Buoy 2014B: , which is just north of the open, warm-PDO waters and current mild spell of the Bering Strait. It reports -0.78° C, which quirks my eyebrow.
AUGUST 11 —DMI Morning Maps—
The genesis of “Steppenwolf” continues, with energy swinging over the top of Norway and also approaching from the southeast. In terms of ice “extent” the wind appear to be blowing out of the Laptev Sea’s open waters, so ice will not “spread out,” and extent will diminish over the next week, though there may be some “spreading out” in Barents Sea. It will take a solid week before “Steppenwolf” moves out towards the Pole; at first it will hug the coast.
It looks like Scandinavia will be seeing a transitional, autumnal pattern start to appear, with more rain than they saw in the summer.
Models are showing an interesting solution for what becomes of “Art” as it fades into Hudson Bay. A more vigorous storm will eat it up, move up Baffin Bay and over the top of Greenland, reform off Greenland’s east coast, and then cross over to Norway. (Transitional patterns have new and interesting storm tracks.)
NEW CAMERAS —Cold north; warm south; what could be more normal?—
Our northern camera gazes across a bleak scene, with temperatures a degree below freezing and winds light.
Our southern camera looks across a slightly milder scene. Conjunct
Buoy 2013F: last reported a mild +1.08° C, though temperatures are now dipping as the sun dips to midnight sunset.
NEW CAMERA —a couple nice mid-morning pictures
I saw these while passing my computer and wanted to share them. I like the northern camera’s picture because the lighting allows us a good view of the pressure ridge crossing from the middle left margin, behind our “cork” and away into the right distance. This ridge has been active through the summer, like a fault-line running through the earth. The fact it has not yet widened into a big lead demonstrates how the ice is not “spread out,” (which we witnessed at the North Pole Camera, before it became “the crunched camera.”)
Temperatures remain below freezing, though they recently rose as winds became calm.
The southern camera views a scene tinted with sunset hues, reminding me summer is ending, and soon even the noontime sun will be low enough to be rosy, and all day will be a prolonged sunset. Also it reminds me I originally came to look through these cameras to see beauty.
(Just since I saved this picture temperatures dropped below freezing and an ice-fog drifted in on winds less than 5 mph.) (So I’ll include two pictures)
CRUNCHED CAMERA REPORT
Our roving wreckage, a pirate with two eye patches, continued its aimless serpentine wander eastwards in near calm, until, towards midnight, it ran into the faintest edge of “Steppenwolf,” still in the process of getting its act together, far away over the coast of the Kara Sea. We swerved south, north and south before the eastward movement abruptly stopped at 9:00 PM, at 17.770°E. By midnight we were back to 17.729°E, but what is interesting is that the wind was reported as being calm. Usually ice responds to wind, and does so rather quickly, however in this case I think we ran into other ice that was being moved by winds further away. In any case, we began back west, swerving first north and then south, as the calm turned into a 10 mph wind, and we ended the day at 83.505°N, 17.637°E.
Temperatures continued their yo-yo antics. We began the 27-hour period at -0.2°C, rose to exactly freezing at noon yesterday, and then sank back down to -0.7°C at midnight, before rising as the winds swung around, reaching +0.7°C by the end of the period at noon today.
Pressures remained very steady, beginning at 1011.1 mb, sinking slightly to 1010.3 mb at midnight, and then rising back to 1011.6 mb at noon. Perhaps a ghost-front passed, or perhaps it was merely a diurnal variation.
AUGUST 12 —DMI AFTERNOON MAPS—
Noon is at the bottom of these maps, and midnight at the top. I expect the subzero readings up on the Pacific side, for they are looking north at the midnight sun near the horizon, looking at it over the top of the earth. I don’t expect the sub-zero readings down on the Atlantic side, for they are looking south at a noontime sun, the same sun but much higher in the sky. This map is, overall, colder than I expected, and this morning’s map was warmer than I expected. Obviously I have to do some tweaking of my expectations, as the summer grows old.
My focus is on “Steppenwolf,” as it develops in the Kara Sea. I likely am missing things elsewhere. “Bertha” is stalled off Norway, and expected to loop back to the mouth of the Baltic, south of Norway. It is bringing big changes to Scandinavia. Also the storm west of Greenland, (which I am going to call “Art” although very little of the original “:Art” remains in its makeup), is going to crash into Greenland, and attempt to cross over a 10,000 foot tall icecap, and will undergo all the changes during transit I call “morphistication.”
I suppose I focus on Steppenwolf most because it will shift the most sea-ice.
QUICK GLANCE AT UK MET
Although Bertha stalled and is occluding north of Scotland, it has driven a cold front all the way into southern Finland. During the height of summer cold fronts had a hard time penetrating the mountains of Norway, and if they did they immediately became warm fronts headed back west. Now the high that was so hard to budge from the Baltic has retreated to the Black Sea. It will try to push the cold front back, but will do little more than make the warm front be part of a frontal wave, rippling up the cold front to the east of Finland. Storms never had the audacity to take such a route back in July.
The storm “Art” west of Greenland will undergo morfistication crossing Greenland, and become a low off the east coast. Rather than stalling over Iceland, as storms did in June and July, it will zip across the Atlantic and park in the North Sea as Bertha has done. Likely it will drive more southwest winds into the Baltic.
Even when the high pressure is not parked over the Baltic, the mountains of Norway, (and to a lesser extent the mountains of northeast Finland,) force storms to either undergo morphistication, just as Greenland does, or storms are forced up over the top of Norway. I never really understood what a power and shelter the mountains of Scandinavia are, until this summer. (Not that I understand, but I now have an inkling.)
This surge moving through Scandinavia is on its way to join the genesis of “Steppenwolf” in the Kara Sea.
NEW CAMERAS —Nothing new—
I’m just posting some evening pictures for the record. Temperatures at both cameras are below freezing and winds are light.
AUGUST 13 —DMI Morning Maps—
If you see the high pressure “Beauf” as the center of the polar cell, displaced towards the Bering Strait, you can see the areas of low pressure as rotating around that cell, though they are stalled, as each is handing off energy to the next. My focus is “Steppenwolf,” on the coast of the Kara Sea, which is sucking energy from the steppes to the south, and also accepting a glob of energy that is coming over the top of Norway from “Bertha”, (the glob will Tarzan down and be joined by another Bertha-glob coming up to the east of the Baltic and Finland.) Meanwhile Bertha will be accpting a glob kicked across the Atlantic from “Art” west of Greenland. The fourth low, in Alaska, needs a name, so I guess I’ll dub it “Loot”, (for “Aleutian Low”).
Noon is at the top of these maps, and the subfreezing temperatures are diminished up towards the Pacific, though an island of cold surrounds our southern-camera. Not far to its west is an island of plus-five-degrees isotherms. I imagine the clash between (relative) cold and warmth will weaken that part of Beauf, and the high pressure as an entity will shift towards Alaska and northern Canada, developing a Pacific to Atlantic flow between it and Steppenwolf.
STEPPENWOLF WINDS AND SPREADING ICE
The map below is one of thousands made available by Dr. Ryan Maue at the Weatherbell Professional Site, and costs me less than the price of a cup of coffee each day. (A week free-trial is available, but watch out, for the maps are addicting.) The map below is from the initial run of the current Canadian “JEM” model, and I’m posting it to illustrate a mistake I have made, and likely will make again.
My mistake is to glance quickly at isobars and use them to guess the flow of the winds. In truth the winds do not follow isobars, as the air in high pressure wants to head for low pressure, and therefore the winds tend to slant across the isobars. In the map below the colors represent the winds speed, but the actual (modeled) flow is shown by the dim gray arrows. (Click the map two times to fully enlarge it.)
In the map below, while the isobars suggest the ice is blowing out of the Laptev Sea, the dim gray lines show the ice is in fact being blown across the northern reaches of that sea, from the East Siberian Sea towards the Kara and Barents Seas. I imagine this will increase the extent, by turning ice-free water into waters dotted with bergs, and qualifying as “ice-covered” the moment the wandering bergs amount to 15% of the area.
An interesting development is that the ice to the north is so packed that, to push any more that way, there will have to be the sort of gales that can pile ice up as a pressure ridge. It is like an accordion pushed in to its limit, where it can’t be squeezed any more. However the areas to the south allow for much spreading, like an accordion opening out. This may explain today’s uptick in the extent graph, which will be under the Maue map.
NEW CAMERA —Still no thawing—
Our noethern camera views a dreary scene where temperatures are struggling to get back up to freezing after spending more than 24 hours below. Winds are around 5 mph. Far to the south towards Fram Strait
Buoy 2014E: was reporting -1.26° C ten hours ago, as our crunched camera even further south reported +0.70°C.
Our southern camera looks out over a colder and more beautiful scene, as the sun has settled towards the horizon and the ice-fog has lifted. Back at 0000z
Buoy 2014B: , west towards Bering Stait, reported +1.13 C, as
Buoy 2014C: to our east reported +0.42 C. We were in an island of cold, struggling to get back up to freezing in a cold fog. (0000z is early afternoon at our southern camera.) I don’t think we quite made it, and since then temperatures have fallen under the clear skies.
It is interesting how low the high clouds look. The stratosphere is much lower at the Pole.
NEW CAMERAS —Lunchtime peek—Thaw north—Freeze south—
CRUNCHED CAMERA REPORT
Our black spot on a pirate’s white page, which some insist is a beauty-mark mole on the fair face of Snow White, drifted steadily south in light breezes of 5-15 mph, wandering west to 17.607°E at 3:00 PM yesterday, and then east to 17.650°E at 9:00 PM, and then west to 17.613°E at 3:00 AM today, before finally wandering east and winding up at 83.429°N, 17.655°E, as our data only gave us a 21-hour-period that ended at 9:00 AM.
Temperatures peaked at +0.9°C at 3:00 PM yesterday, before the north wind and lowering sun drew the temperatures down to a low of +0.1°C at 3:00 AM. The rising sun hasn’t brought much of a rebound so far, and temperatures are at +0.2°C at 9:00 AM.
Pressures remain flat, finishing at 1011.3 mb, which is where we were two days ago. We remain betwixt and between.
AUGUST 13 —DMI Afternoon maps—
“Steppenwolf” is biding his time in the Kara Sea, as “Bertha” sends low pressure oozing over the top of Norway, and “Art” looks completely blocked by Greenland. The main event it the face off between the high pressure of “Beauf” and the low pressure of “Steppenwolf”.
As seen by our cameras, it is thawing at the Pole and colder 800 miles south, in the Beaufort Sea north of Alaska. I foresee a clash developing as “Beauf” brings cold air from Alaska around to contact milder air “Steppenwolf” is bringing north through the Kara Sea.
NEW CAMERAS —A milder interlude—
Our northern camera has seen temperatures right at freezing for an extended period, though a pool of sunfreezing air lies towards Svalbard, where
Buoy 2014E: reported a chilly -2.32° C at 1200z, even though our crunched camera reported +0.20°C at 0900z not all that much further south. Winds at our camera remain light, around 2-5 mph. Temperatures may dip, if the skies stay clear.
Our southern camera saw the coldest temperatures this side of the solstice, as the midnight sun rolled along the horizon. The conjunct
Buoy 2013F: reported -4.67 C, as towards waters north of Bering Strait
Buoy 2014B: came in at -2.53 C, and to our east
Buoy 2014C: spoke of a cold -3.13 C. That was at 1200z, which is the wee hours at our camera. Since then temperatures have rebounded and are flirting with freezing. Interestingly, again as it warmed the scenery grew Gray and foggy. It looks like our larger melt-water pool has a skim of ice again. Winds remain light, 5 mph.
AUGUST 14 —DMI Morning maps—
“Steppenwolf” continues to sit in the Kara Sea without moving towards the Pole, as a northern blob of “Bertha” squeezes over the top of Norway to join the fray. The situation is starting to stray from the picture models foretold, and we may be seeing “Steppenwolf” at its strongest. Models now see it moving to the northern Laptev Sea and weakening; it will be interesting to see if an area of cold appears where it fills. (The energy that might have reinforced Steppenwolf now looks like a successor, “Wolfson,” which might park in the Laptev Sea in the manner Steppenwolf parked in the Kara Sea, next week.) (But that is looking pretty far ahead, and we’ve seen models can’t be trusted this summer.)
“Art” has vanished into the mystery of morfistication as it crosses Greenland. That weak area of low pressure appearing along Greenland’s east coast will slide south, pick up a ripple of energy
sneaking under Cape Farewell, and then move towards Iceland tomorrow, strengthen as it passes Iceland Saturday, be a North Sea low on Sunday, and finally become a major, stalled feature over Scandinavia next week, as the summer high pressure is replaced by an extended period of low pressure.
I can’t figure out what’s up with the scattered pools of subfreezing temperatures swirling around the Pole. Noon is to the top, and there is more cold up that way than I expect, but less cold on the Atlantic side. When I have time I’ll check out some Dr. Ryan Maue maps over at Weatherbell. Though I value the simplicity of the DMI maps, sometimes more detailed, modeled maps show you all sorts of subtle features swirling about. Sometimes it’s too much to understand, being basically chaos, but then at least you know why you don’t understand.
NEW CAMERAS
Our northern camera has seen a period of subfreezing temperatures as low as minus 2, with winds picking up slightly to 5-10 mph. There may be no sign of thaw, but the ice is still thinning from beneath, and I’m still watching dfor signs of the ice breaking up and spreading apart. One thing to watch for is dark undersides on clouds along the horizon that don’t move even as the clouds move. I haven’t seen any, but when you see them they indicate patches of open water.
Our southern view shows a thick fog, with winds a steady 8 mph and stirring the fog, and, after a spell of barely thawing (back at 1200z conjunct
Buoy 2013F: reported +0.20° C), temperatures are now dipping just below freezing. I don’t think the fog is thick vertically. It looks dark because the sun is low on the horizon.
SAME VIEW 2 1/2 HOURS LATER
AND THE SAME VIEW AGAIN, 1 3/4 HOURS LATER
It is the sheer beauty of pictures such as this one that drew me to the polar cameras in the first place. It is secondary trivia that the temperatures are plunging in the view, and low sun quite obviously isn’t doing any melting at the moment. The politics involved with such trivia is exactly the sort of nonsense I came to the camera to escape.
CRUNCHED CAMERA REPORT
Our unremembered dream drifted wraith-like south on 5 mph winds from the chilling north, veering and backing and veering and backing and veering and winding up, all in all, a little further east at 83.367°N, 17.528°E.
Temperatures remained steady at +0.2°C from 9:00 AM until 6:00 PM yeaterday, then fell to -0.4°C at midnight, struggled back to -0.1°C at 6:00 AM, and then slumped back to -0.5°C at 9:00 AM.
The pressure remained very steady, finishing at 1011.1mb.
AUGUST 14 —DMI Afternoon Maps—
“Steppenwolf” is weakening as it edges eastward in the Kara Sea. It is a bit disappointing. When you give a low a cool name like “Steppenwolf,” you expect more from it. Perhaps the blobs of low pressure tarzaning down from Norway and underneath it will kick some life into the lazy storm, but I’m starting to think the low may be an underachiever. I had hopes it would spread the ice a bit, and save my minimum extent forecast, but it is demonstrating no gratitude towards me for giving it such a cool name. I may rename it “Dunce”, or some such thing, tomorrow.
“Art” is reappearing to the east of Greenland after morphistication, but is still weak.
Midday is at the bottom of the maps, and midnight at the top, so the subfreezing air on the Pacific side is expected, and the cold air north of Greenland a little unexpected.
NEW CAMERA —(yawn)….nothing new—
The northern camera is flirting with thaw again, after a dive to minus two earlier. The cold air has headed south towards Fram Strait, and
Buoy 2014E: just gave us a 0000z report, (it being tomorrow already, there,) of -2.63 °C.
Not much sign of action at our site. The melt-water pools have receded like sunken eyes. The crack behind our yellow “cork” looks like it has widened slightly. But with winds only around 5 mph, there’s not much chance in the short term of seeing the excitement of the ice breaking up.

After another chilly period of midnight sun, not quite so cold as yesterday but down around minus-three, the sun has climbed and so have temperatures, and the fog has reformed. A faint fog-bow is vi sable, as conjunct
Buoy 2013F: reports a 0000z reading of + 0.09 C. To our west
Buoy 2014B: is coming in at a thawing +0.77 C, but to our south-southeast
Buoy 2014C: shows the cold standing tough at -1.25 C. (That buoy was once well east of us, but is riding faster ice, and may pass south of us if things continue as they have.) Our ice remains solid. Remember that ice didn’t even exist at this location, when the PDO was warm, or, if there was ice, it was broken up and covered in melt-water pools. (See picture earlier in this post, towards the top.) The ice we look upon now is far more boring. The only ecitement I can see is that the melt of the snow has revealed a refrozen crack in front of the “robot.” At times even though these cracks are refrozen they can indicate weaknesses, and be where the ice cracks and leads form.

LINK TO A GOOD COMPARISON BETWEEN THIS SUMMER’S ICE AND 2012’S
stephengoddard.wordpress.com/2014/08/14/more-detail-on-the-arctic-catastrophe/
In the comments I share my observations, and also reply to a fellow who thinks he is being tricky when he is in fact being sadly transparent.
AUGUST 14 —DMI Morning Maps—
In a rush and have no time to comment. Warm air entering through Bering Strait and up through Laotev Sea, but a surprising amount of subfreezing air exists in the upper “noontime” side of the map.
NEW CAMERAS
Our northern camera saw a thaw of around six hours a hair above freezing, but is back to a hair below. The winds remain light, around 2 mph currently. Nothing much will change in this gray view unless the wind picks up. It is interesting how the water in the melt-water pools seems lower.
Our southern camera shows the brief thaw is over and the mist is gone, as temperatures again sink below freezing as the sun dips down to a midnight spent rolling along the horizon. (Some the haze on the horizon may be due to forest fires in Siberia.)
LUNCHTIME PICTURE
I wanted to include a picture from our southern at the end of a “night” of midnight sunshine, when temperatures are just starting to rise after their daily dive.
Buoy 2013F: was reporting -3.97 C at 1200z, which is the wee hours of morning in our southern camera’s time-zone. It looks like the melt-water pool has again skimmed over with ice, despite the bright sunshine.
Now we are likely to see temperatures rebound back up to freezing, and perhaps a half degree higher. It will be interesting to see if mist and fog again form.
CRUNCHED CAMERA REPORT
Our guilt-ridden heap of junk, mortified about disappointing so many fans, skulked slowly but steadily south and west in light winds of 5 to 10 mph, ending the 24-hour-period at 83.312°N, 17.234°E. (I wonder at what point the progress of the ice is slowed or alterd due to the simple fact it starts bumping up against the north coast of Svalbard.)
Temperatures bottomed out at -0.8°C at noon yesterday, and then temperatures rose, getting above freezing in the late afternoon and then flattening out, achieving the high temperature of +0.5°C at 6:00 AM today, and then settling back to freezing at 9:00 AM.
Pressures remained flat for the fourth straight day, ending up at 1011.4 mb.
AUGUST 15 —DMI Afternoon Maps—
“Steppenwolf” ias weaker and crossing into the Laptev Sea, as “Art” is stronger and moving towards Iceland. I’ll dub that blob of low pressure north of Norway, “Berzip,” as it spun off Bertha, who is now south of Norway.
This year is exactly the opposite of last year, which had all the high pressure on the Eurasian side and low pressure on the Atlantic side. Consequently the cross polar flow is completely reversed, from Pacific to Atlantic rather than from Atlantic to Pacific. ( You can check out the old history at my old post from last August, as long as you don’t laugh at the fact I was learning the ropes about the Arctic, and was even more of a boob than I now am. The old post is found at sunriseswansong.wordpress.com/2013/08/16/the-big-chill-sea-ice-version/ ) I wonder if this hints that the people of western Europe will have a winter opposite last winter’s mildness.
Last year we’d just seen a gale cross the Pole. At this point I see no sign of a gale this year, nor of the post-gale temperatures down to minus-eight-degrees.
MY FORECAST WAS WRONG—“STEPPENWOLF” DIDN’T SPREAD ICE OUT—IT COMPRESSED IT—
At his site at “Real Science” Steve Goddard explains the map below by stating, “Red shows ice extent loss since August 7, green shows gain. High pressure has been creating winds which are compacting the ice in the Chukchi, East Siberian and Laptev Seas, and will continue to do so for at least a few more days.” I did not expect this compression, and in fact expected the opposite. Arrgh! I hate being wrong, which seems odd, as I’m so good at it, and you’d think I’d be used to it by now.
It seems a good time to think about starting a new post. That way I don’t have to face admitting my mistake each time I update.
NEW CAMERA —Cross polar transport of cold—
Our northern camera is starting to record subfreezing temperatures steadily, as winds transport the chill from the Pacific side to the Atlantic side. Winds are still light, 2-6 mph.
Our southern camera saw cold build, as I reported earlier, but now experiences a rapid return towards thawing, as its air is transported toward the Atlantic. (Neighboring buoys also reported a cold “night.”) No mist has appeared. Winds have picked up slightly to 7 mph.
AUGUST 16 —DMI MORNING MAPS—
NEW CAMERA —Some pretty views—
Northern camera sees steady temperatures around minus one, and light 5 mph winds.
Southern camera sees temperatures starting to bounce back from midnight-sun lows near minus five, and a light breeze around 7-8 mph.
CRUNCHED CAMERA REPORT
On cold winds of 10 mph our zombie apparatus drifted west-southwest to 83.241°N, 16.740°E.
The temperature dipped below freezing at the very start of our 24-hour period, passing zero and giving us our high temperature at 9:00 AM yesterday, and continuing down to our low of -2.2°C at 3:00 AM, before recovering to -1.5°C at 9:00 AM. We were below the freezing point of salt water from 6:00 PM until 6:00 AM.
The pressure fell to 1007.6 mb at 3:00 AM and then rose to 1009.4 mb at the end of our period.
AUGUST 16 —DMI AFTERNOON MAPS—
A weak “Steppenwolf” is sliding east into the Laptev Sea, as a following weak “Berzip” moves east across Barents Sea. “Art” is growing stronger as it moves away from Iceland towards Norway, and models show “Art” as a pain for Scandinavia next week, unless they need rain. The high pressure “Beauf” is bringing cold air towards the Atlantic side.
NEW CAMERAS —
Our northern camera shows light winds and sunshine allowing temperatures to touch freezing after 24 hours a degree or two below. No signs of change on the ice, and I don’t expect much until the wind picks up.
The cross-polar flow has brought cold air down to our crunched camera, and to
Buoy 2014E , which reported -1.46° C at 1200z ainking to -2.23° C at 0000z. It may have warmed at the Pole due to bubbles of milder air “Steppenwolf” swung north over the ice-free Laptev Sea.
Our southern camera shows mist forming again, when the sun is highest. Temperatures have failed to recover to freezing, as a light breeze has slightly increased to 8 mph. Our conjunct buoy
Buoy 2013F: reported -3.80 C at 1200z and -1.21 C at 0000z. To the west
Buoy 2014B also failed to reach freezing, reporting -1.46 C. Only
Buoy 2014C: to the southeast reported any thawing, at + 0.52 C at 0000z.
This seems to be home-grown cold, as there are no colder places for the air to come from.
AUGUST 17 —DMI Morning Maps—
COMPARING THIS SUMMER WITH LAST SUMMER
Last summer is the map to the right. The flow was from Norway towards Alaska. This year it is from Alaska to Norway.
NEW CAMERA —Beautiful but cold—
Our northern camera sees a scene that has slipped back below freezing, despite bright sunshine and light winds of 5 mph. The humidity has dropped to 85%, which is actually quite low for the Pole during the summer. After all, we are on the surface of an ocean.
The sun is rising, but because we remain only two degrees from the Pole, it doesn’t get that much higher at noon than it is at midnight. We are at 88 degrees north, while our southern camera is at 77 degrees, and does see the sun rise and dip much more.
Our southern camera sees the sun setting down towards midnight, and you can see from the orange light it is getting close to the horizon now, as days get shorter further south. Soon the midnight sun will give way to periods of midnight twilight.
Temperatures fail to get up to freezing even during the warmest part of the day, yesterday. Now they have started dipping down again. Winds have slacked off slightly, to 6 mph. The chances of significant surface melting are growing slim, but there still may be melting from beneath for around another month. Temperatures have to get down to around minus ten for the cold to penetrate the insulating ice, and start growing new ice at the bottom of the bergs and floes. In open leads new ice starts forming where water touches ice at minus 1.7 degrees.
CRUNCHED CAMERA REPORT
Our asterisk on a blank page continued south and west in winds that slackened slightly to 8 mph, ending the period at 83.147°N, 16.579°E.
We spent the entire time below freezing but above the freezing point of salt water, starting with our low of -1.5°C at 9:00 AM yesterday and slowly rising to our first high of -0.8°C at 9:00 PM, and then sinking to a second low of -1.3°C at 6:00 AM, and then springing up to our high of -0.3°C at 9:00 AM.
Pressures stayed fairly steady, finishing the period with a slight rise to 1010.3 mb.
AUGUST 17 —DMI Afternoon Maps—
“Steppenwolf” is nudging north towards the Pole, but likely will be drawn back as it weakens by “Berzip” swooping under it and then tarzaning up. We will have to watch for two things. First, will Steppenwolf create any cold air as it weakens and fills. Second, as “Berzip swing up and around towards the Pole, will it be pulled back by yet another low swooping under and up, or will it claim the king-of-the-world status, atop the Pole.
“Beauf” has shifted more towards the Canadian Archipelago, as warmth and a storm brews in the Bering Strait, but likely won’t come north. The cross-polar-flow from Alaska to Norway continues, as “Art” has reached the North Sea.
QUICK GLANCE AT UK MET
“Art” is actually strong for a summer storm. It looks a little like an early autumn. It will move over Sweden and just sit there much of the week.
NEW CAMERAS —A sunny spell—
Our northern view seeing light winds of 4 mph and temperatures that have just risen to touch freezing, after being jusr below all day.
Our southern view shows temperatures again stubborn about rising as the sun does, but the wind is rising, now up to 14 mph. A rising wind speaks of a change in the weather.
NOTE—This is the final picture submitted by the southern camera on Sunday. I have no idea what the problem is. As we are looking north, there is no way of knowing if the ice is breaking up behind our back, to the south. Or it could be that because the wind has risen the dish-reception needs to be tweaked to transmit a picture. However last year O-buoy 7 continued to transmit even as it bobbed about in open water. So…your guess is as good as mine.
As this post has gotten overly long, the post will continue as a new post called “ARCTIC SEA ICE MELT —The Thaw’s End— ” which will begin with these two maps (and observations:)
ARCTIC TEMPERATURES —THE THAW’S END—

(click to enlarge)
The green line on this map shows we have passed the point where temperatures north of 80 degrees latitude average out above freezing. This is not to say that pockets of thaw can’t come north. I’ve seen above-freezing temperatures take a run at the Pole from the Atlantic side even in the dead of winter, associated with huge North Atlantic storms. However that sort of warmth tends to swiftly lift above the ice and, while the uplift may generate a low pressure’s winds that rip and tear at the ice, it simply doesn’t have the thawing effect of summer sunshine. We are pretty much done the time of watching melt-water pools expand. In fact the 90 days when the sun it as its highest and beats down most strongly (if you can use such words to describe the low arctic sun) ended back on August 5. The above graph shows the temperatures starting to respond to the sinking of the sun. There can be a warm spell after the green line shows the average ordinarily sinks below normal. For example, look what happened in 1979:

You can see that in 1979 the thaw continued for a week longer than normal, despite the fact it was a very cold year, and the prior winter had some of the lowest temperatures ever seen at the Pole.
This trivia demonstrates how little air temperature and surface thawing (and the hubbub about “albedo”) actually has to do with the growth and shrinkage of arctic sea-ice. We will also see this demonstrated for the next thirty days, as the sea-ice continues to shrink despite temperatures that will drop well below the freezing point of the salt water the ice floats upon. (The ice itself has far less salt in it, as it extrudes the salt that was originally in it through several processes, and of course any snow and rain that falls on the ice, and fog that condenses on the ice, is fresh water.)
What really determines the amount of sea-ice is how much ice is flushed south through Fram Strait, (not much, this year,) and how much warm water comes north through the Bering Strait, (associated with a “warm” PDO), and comes north as tendrils of the Gulf Stream (associated with the “warm” AMO.)
We have seen the ice respond very nicely to short term spikes of the PDO and AMO during the past year, which affirms the idea the sea-ice has not been responding to CO2 and is not in any sort of “Death Spiral,” but rather was responding to natural cycles which take roughly 60-70 years to complete.
MY FORECASTING FLOP —THE FAILURE TO FLAT-LINE—
The graph below shows the ice-extent plunging at the very time I expected it would level off. My idea was that the tightly packed ice would spread out, like a pat of butter on a wide piece of bread, but what has happened is that the ice has been compressed, both north of Alaska and north of the Laptev Sea.
It is important to make a forecast even if you are not an expert, because it is through seeing where your forecast went wrong that you learn about things you otherwise would fail to notice.
If you don’t dare make your own forecast, and instead rely on models, you can be amazingly wrong, but you will have no idea why you are wrong. For example, last June the CFSv2 model was predicting a September ice minimum up around 7 million km2 with an anomaly of +0.6 million km2, and now it predicts 5.9 million km2 with an anomaly of -0.3.
Models flip-flop all the time, especially once you are looking more than ten days ahead, and when they are wrong they never blush, and instead simply change. It is the people who consider models to be authorities that wind up blushing, (or they should blush, but sometimes simply go from parroting the old to parroting the new.)
My own guess was for a minimum of 6.1 million km2, which is obviously too high. However rather than blushing I’m focused on trying to see what is keeping the ice from spreading out.
AUGUST 18 —DMI MORNING MAPS—
NEW CAMERAS
Our northern camera is seeing temperatures dropping down to around minus 2.5 and winds slacking to around 5 mph.
Our southern camera is failing to transmit updated pictures, but saw some thaw yesterday after a prolonged freeze, and winds grow brisker, up to the 15-20 mph range, as temperatures again dropped below freezing.
This post will be continued at https://sunriseswansong.wordpress.com/2014/08/18/arctic-sea-ice-melt-the-thaws-end/