This is the continuation of a long series of posts, the last of which can be found at: ARCTIC SEA ICE MELT —The Death Spiral’s Debunking—
When I began this series of posts I was vaguely aware that I had already investigated the arctic more than most so-called investigative reporters who wrote about the subject. My investigation was accidental, and a side-effect of my escapism. As a boy I didn’t like math class, and dreamed out the window at clouds. While this meant I never learned the math necessary to become a meteorologist, it makes me something of an authority on clouds. In like manner, I have become something of an authority on sea-ice.
I never meant to involve myself in politics. I didn’t pursue politics, politics crashed my quiet party in a quiet place that, not so long ago, cool people and babes were not the slightest bit interested in. Weather and arctic sea-ice were safe and innocuous topics that avoided all trouble. Those days are gone.
I’ve had a hard time figuring out what hit me. If you look back through these posts you’ll see quite a variety of introductions, as I attempt to explain my reasons for writing. In actual fact the real reason is that I was minding my own business, enjoying a quiet bit of escapism, when Alarmist lunacy walked up and hit me across the side of my head.
That will wake up the most peaceful and dreamy guy, and much of my investigating over the past year has been in response, and has been at times defensive, and at times offensive, and the conclusion of this episode is that I’ve whipped the tar out of Alarmist lunacy. (In a purely intellectual manner, of course.)
Now I’d like to conclude these posts by tying up a few loose ends, before I go back to dreaming. A guy of my advanced age should be quiet, and retiring.
I’ll try to post maps and information twice a day, until the sea-ice reaches its minimum.
ARCTIC TEMPERATURES —THE THAW’S END—

(click to enlarge)
The green line on this map shows we have passed the point where temperatures north of 80 degrees latitude average out above freezing. This is not to say that pockets of thaw can’t come north. I’ve seen above-freezing temperatures take a run at the Pole from the Atlantic side even in the dead of winter, associated with huge North Atlantic storms. However that sort of warmth tends to swiftly lift above the ice and, while the uplift may generate a low pressure’s winds that rip and tear at the ice, it simply doesn’t have the thawing effect of summer sunshine. We are pretty much done the time of watching melt-water pools expand. In fact the 90 days when the sun it as its highest and beats down most strongly (if you can use such words to describe the low arctic sun) ended back on August 6. The above graph shows the temperatures starting to respond to the sinking of the sun. There can be a warm spell after the green line shows the average ordinarily sinks below normal. For example, look what happened in 1979:

You can see that in 1979 the thaw continued for a week longer than normal, despite the fact it was a very cold year, and the prior winter had some of the lowest temperatures ever seen at the Pole.
This trivia demonstrates how little air temperature and surface thawing (and the hubbub about “albedo”) actually has to do with the growth and shrinkage of arctic sea-ice. We will also see this demonstrated for the next thirty days, as the sea-ice continues to shrink despite temperatures that will drop well below the freezing point of the salt water the ice floats upon. (The ice itself has far less salt in it, as it extrudes the salt that was originally in it through several processes), (and of course any snow and rain that falls on the ice, and fog that condenses on the ice, is fresh water.)
What really determines the amount of sea-ice is how much ice is flushed south through Fram Strait, (not much, this year,) and how much warm water comes north through the Bering Strait, (associated with a “warm” PDO), and comes north as tendrils of the Gulf Stream (associated with the “warm” AMO.)
We have seen the ice respond very nicely to short term spikes of the PDO and AMO during the past year, which affirms the idea the sea-ice has not been responding to CO2 and is not in any sort of “Death Spiral,” but rather was responding, is responding, and will respond to natural cycles which take roughly 60-70 years to complete.
MY FORECASTING FLOP —THE FAILURE TO FLAT-LINE—
The graph below shows the ice-extent plunging at the very time I expected it would level off. My idea was that the tightly packed ice would spread out, like a pat of butter on a wide piece of bread, but what has happened is that the ice has been compressed, both north of Alaska and north of the Laptev Sea.
It is important to make a forecast even if you are not an expert, because it is through seeing where your forecast went wrong that you learn about things you otherwise would fail to notice.
If you don’t dare make your own forecast, and instead rely on models, you can be amazingly wrong, but you will have no idea why you are wrong. For example, last June the CFSv2 model was predicting a September ice minimum up around 7 million km2 with an anomaly of +0.6 million km2, and now it predicts 5.9 million km2 with an anomaly of -0.3.
Models flip-flop all the time, especially once you are looking more than ten days ahead, and when they are wrong they never blush, and instead simply change. It is the people who consider models to be authorities that wind up blushing, (or they should blush, but sometimes simply go from parroting the old to parroting the new.)
My own guess was for a minimum of 6.1 million km2, which is obviously too high. However rather than blushing I’m focused on trying to see what is keeping the ice from spreading out.
AUGUST 18 —DMI MORNING MAPS—
NEW CAMERAS
Our northern camera is seeing temperatures dropping down to around minus 2.5 and winds slacking to around 5 mph.
Our southern camera is failing to transmit updated pictures, but saw some thaw yesterday after a prolonged freeze, and winds grow brisker, up to the 15-20 mph range, as temperatures again dropped below freezing.
CRUNCHED CAMERA REPORT
Our heap of tax-dollars continued to drift west and south, in winds that slacked off to the 5-10 mph range, winding us up at 83.051°N, 16.303°E at the end of our 24-hour-period, at 9:00 AM
For the third day temperatures failed to get above freezing, though we did just touch zero at noon yesterday. Our low was -1.5°C at 3:00 AM this morning, and it had risen back to -0.8°C by 9:00 AM. The chill is a little unusual, when you consider out wrecked “North Pole Camera” has now drifted roughly 425 miles south of the Pole towards the warm Atlantic, and it is still summer.
The pressure continues steady, though it has fallen ever so slightly over the past five days, arriving at 1009.9mb at the day’s end.
AUGUST 18 —DMI Afternoon Maps—
A sort of fujiwhara effect is tugging “Steppenwolf” back east, as “Berzip” will be swung under and then whipped up north through the Laptev Sea. (The open water of the Laptev Sea will be a magnet and generator of storms this fall,,,perhaps I should call it “an electromagnet”.)
“Art” is crashing into Norway, creating a pattern very different from the lovely summer Scandivaian High. The wind cannot get over Norway’s mountains, but the low is perfectly positioned to swing the wind down Norways west coast, swing them east ove Debnmark and into the Baltic, and then whip them up from the southwest into the south-facing coasts of Sweden, and even Finland.
The cold is building towards Canada, and we may soon see the minus-five isotherm appear for the first time since June.
QUICK GLANCE AT UK MET
I just wanted to save this map of “Art” over Norway. “Art” is of decent size, for a summer storm, and completely unlike the pattern we saw all July. I would call this a transitional pattern, and not a foretaste of winter’s pattern.
NEW CAMERAS —
Our northern camera views a cold world gone gray, with temperatures below freezing and the light airs stiffening ever so slightly to a ling breeze of 5-10 mph. My expectation is that we won’t see any more serious thawing this summer. I’m even beginning to wonder if we’ll see the ice crack up at all.
Our southern camera isn’t working. Likely it wants higher pay. Temperatures are warmer than the past few days, and winds in the 10-15 mph range.
Conjunct
Buoy 2013F: reported that at 0000z the “warmth” of the day had temperatures up to -0.49° C. To the west, north of Bering Strait,
Buoy 2014B (which may be in danger due to thinning and fracturing ice) reported -0.22 °C, while to the southeast
Buoy 2014C: is reporting -0.04° C. Weak low pressure is attempting to form between this camera and the Alaskan coast.
AUGUST 19 —DMI MORNING MAPS—
“Steppenwolf”and “Berzip” are doing their Fujiwhara dance, and also drawing in some low pressure from Bering Strait. They will resolve to a storm in the Kara Sea, nudging towards the Pole and bumping the high pressure “Beauf” to the south into Canada, however for the time being the Pacific to Atlantic cross polar flow continues.
“Art” looks like he is giving Scandinavia a miserable Monday.
The storm in northern Hudson Bay came up through Winnepeg, so I’ll dub it “Peg.”
Notice how warm the arctic shorelines are. We are in the final days when the tundra is warm and the mosquitoes drive all living creatures wild. Soon tundra temperatures will plunge, mosquitoes will die, and the arctic shorelines will switch from warming the Arctic Sea to chilling it.
NEW CAMERAS
Our northern camera shows cold conditions, with temperatures down around minus five Celsius. The cold isn’t due to calm, as the winds are around 10 mph. Notice how our frozen melt-water pools are now covered by a dust of snow.
They haven’t fixed the southern camera yet. I wish they would, as some changes are occurring as “Beauf” moves away and weak low pressure from the Bering Strait passes over. Temperatures are milder and winds are dropping off. We may be missing our chance to see the last thaw of the season.
CRUNCHED CAMERA REPORT
Our lone chocolate jimmy atop a vast expanse of vanilla continued south and west with a light breeze of 5-10 mph, crossing both 83 degrees latitude and 16 degrees longitude, to wind up at 82.991°N,15.955°E. (Last year we were either side of the meridian, and dawdled either side of 84 degrees north, until October.)
Another day passed with temperatures failing to break freezing. That makes four days. We reached our high temperature for the 24-hour period at noon yesterday, -0.4°C, and then readings fell, with a twelve hour period of temperatures below the freezing point of salt water, reaching our low of -3.2°C at 3:00 AM. Temperatures had recovered to -1.5°C by 9:00 AM.
Pressures remained fairly steady, ending at 1009.0 mb.
AUGUST 19 —DMI Afternoon Maps—
AUGUST 20 —DMI Morning Maps—
I like to put two sets of maps (or more) together like this because it allows part of my brain to animate the action, and to predict more in the manner of a boy predicting where to run to catch a ball, than in the manner of a math whiz figuring out where the ball will land with numbers on paper.
Noon is at the bottom of the first set of above maps, and at the bottom of the second. This explains a lot, but not all, of the warming on the Pacific side.
The one feature that leaps out at me is the breakdown of high pressure “Beauf” on the Canadian side, and the build-up of low pressure on the Eurasian side. On the Eurasian side not only are “Steppenwolf” and Berzip” continuing their Fujiwhara dance, but that dance is sucking in unnamed low pressure from the Bering Strait, and also up from the Steppes of Russia. This new multi-ingredient storm needs a name, but I think I’ll stick with the name “Steppenwolf.” By using that name it makes my forecast (or hunch) of a week ago correct. I said Steppenwolf would be a certain place, and look, there is Steppenwolf, exactly where I said. This may be cheating, but I figure I should get some benefits from running this blog, and one benefit is that I get to name storms in a way that makes me look smarter than I actually am.
In any case, this undulating blob of different pieces of low pressure will be interesting to watch, as several models have it moving to the Pole, and on to Canada, which may very well spread out the sea-ice and cause the “extent ” graph to flat-line next week.
“Art” continues to occlude over Scandinavia, giving Great Britain a northerly flow and likely freaking everyone out, as it feels like summer is over. (By the way, “Art” originally got his name as it was part of Hurricane Arthur. It demonstrates another reason I like to control the naming of storms. It is just plain fun to follow an impulse of low pressure from the Bahamas to Europe to the Kara Sea across the Pole into Canada and down around Greenland and across to Europe again. Purists may roll their eyes and point out “Art” actually includes .0001% of Hurricane Arthur, but they are no fun.) “Art” will send a bulge through Finland and along the arctic coast to join “Steppenwolf”, eventually.
The third storm is “Peg” up at the top of Hudson Bay. It’s west side is sucking some cold from the core of “Beauf” and sending it down my way, which I don’t much like to see this early in the year.
“Beauf” is exporting cold both into the North Atlantic and into central Canada. Likely temperatures will warm some, over the Pole, with the cold air exported. However, because all this cold is home-grown, it demonstrates the Arctic is a sourse of cold even in August, and also that the Pole, in some manner, loses heat even when the days are 24 hours long.
QUICK GLANCE AT UK MET
This is here to record the big change over Scandinavia, as “Art” occludes over Norway. Rather than just filling and fading, part will move into the arctic through Finland, and part will be reinforced as that little low over Iceland moves to the North Sea. There is no sign of the nice, warm Scandinavian high returning.
NEW CAMERA —Southern Camera Fixed—
Our northern camera continues to experience a bitter cold flow of air, even as winds slacken to the 2-5 mph range, and the high pressure “Beauf” weakens. Temperatures have been down around minus five for two days, and the power of this cold flow extends all the way down to our crushed camera 425 mikes south, which has gone four days without thaw, and to
Buoy 2014E: , which was reporting -2.92 C at 0000z. The ice we view currently shows no sign of breaking up and spreading out, and the lead behind our yellow “cork” has in fact clamped tighter than a bear trap. Nothing will happen until we get some stronger winds.
If you look back through old posts you’ll notice our yellow “cork” was lying more on its side a couple weeks ago. While it was milder it melted its own, private pool of water to float in. Until these private pools that buoys make in the bright sun refreeze, it can mess up the ice-thickness readings. However this is something the scientists in charge are well aware of.
With all the cold air heading across the Pole to the North Atlantic, it is only natural for it to warm on the Pacific side, and we are seeing some of that. The ice is actually moving north, which makes me a little nervous as the edge of the ice is closer to our southern camera, and to our other buoys. Our ice is still around 4 feet thick, but
Buoy 2014C: to our east is reporting ice only 2 feet thick, and
Buoy 2014B is floating in its own private pool, and its reports have been suspended until the water refreezes, however its ice was only 2 feet thick back on July 29.
Temperatures have been much warmer, even in the “night,” than they were when the high pressure “Beauf” was overhead. Conjunct
Buoy 2013F: had dipped to -0.26 C at 0000z, but
Buoy 2014C: was reporting +0.10 C and
Buoy 2014B was reporting + 0.22 C. The fixed southern camera is showing a view that looks a little softer and more slushy than it looked just before the camera went off the air, though by no means is there signs of a major thaw.
I expect temperatures will remain near freezing until the winds change.
CRUNCHED CAMERA REPORT
Our cigarette burn on the vast white bed-sheet of sea-ice continued south, but its westerly motion became more serpentine, arriving at 15.798°E at midnight, backing to 15.846°E at 6:00 AM, and then veering to end us, at the end of our period (27 hours for some reason,) at 82.888°N, 15.794°E at noon.
The north winds were cold. Only at the start of our period were temperatures above the freezing point of salt water, at -1.5°C at 9:00 AM yesterday. By noon they had fallen to -1.9°C and at 6:00 PM were at -3.6°C. After that temperatures fell more gradually to the day’s low of -3.8°C at 3:00 AM, and only recovered to -3.1°C by noon today. Ice can still melt at the bottoms of larger bergs at these temperatures, but any splashes at the edges freeze.
The pressure fell to 1005.0 mb at midnight and then rose to 1006.1 mb at noon.
The water at the northeast corner of Svalbard is now open.
AUGUST 20 —DMI AFTERNOON MAPS—
The Pacific to Atlantic flow continues, pulling cold air from Alaska to Svalbard.
NEW CAMERAS —A tale of two buoys—
With winds slacking and temperatures down around minus five, the bright sun can do little thawing to the north. The cold flow extends all the way down to our crunched camera, but Buoy
Buoy 2014E: was coldest, at -6.73 C.
Our southern camera sees a milder world, (despite some subfreezing cold as the midnight sun sunk low). Our conjunct
Buoy 2013F was at -0.03 C, and not one other buoy over there towards Alaska showed less. Thaw is general towards the Pacific at this time.
AUGUST 21 —DMI MORNING MAPS—BIG CHANGES—
“Steppenwolf” continues to evolve in the Laptev Sea, and will be the feature to watch the next week. It is complex and likely deserves to be divided into five storms with five names, but I am too busy to do it justice.
“Art” continues to wallow over Scandinavia, but is handing off a piece of energy to the east to the Steppenwolf complex.
Very interesting is “Peg” crashing north over the Canadian Archipelago, bringing a slug of warm air with it. After initial warming, I imagine the home-grown-cooling process might kick in, and Peg, and also the rush of Pacific air in from Bering Strait, will get swirled into the Steppenwolf mix and result in post-storm cooling.
The warming is not showing up in the DMI temperature graph because it at this point is largely occurring south of 80 degrees latitude. The graph reflects the stream of very cold (for the time of year) air the high pressure “Beauf” steered across the Pole and down towards Svalbard. What remains of Beauf is west of Iceland, its north winds adding to Art’s west side north winds, and inhibiting the surface flow of the Gulf Stream. The DMI graph, which has been crashing, will likely soon spike up.

(click to enlarge)
As the various parts and pieces of the Steppenwolf complex wheel about the Pole the general effect will be to reverse the recent compression of sea-ice, and to spread the ice out more. This will be especially true if models are correct, and a low sits north of Bering Strait next Tuesday in the exact position where the high pressure “Beauf” sat a week ago.
In the long term some suggest this spread-out ice (from the East Siberian Sea into the Chukcha Sea, and from the Central Basin into the Laptev Sea), will melt “in a twinkling” due the ice moving to warmer waters. I myself don’t think the waters are deeply warmed, and doubt the melting will be that swift.
Two conflicting factors are in play, the first being a cooling factor, because the Bering Strait was late to freeze and the Laptev Sea was often open last winter, which exposed waters to winter cold and chilled the water (and also churned it), and the second warming factor being that the spoke in the PDO to a “warm” phase likely brought some Pacific water north, at the same time that, in the Laptev Sea, the factors of water from the Lena River plus a summer’s worth of ice-free sunshine (when it wasn’t cloudy) has likely warmed the surface.
My guess is that warm surface waters aren’t enough; warmer waters from a greater depth are required to melt ice “in a twinkling,” and such waters don’t exist. Time will tell. The “in a twinkling” scenario would involve the “extent graph” only briefly showing an uptick, before plunging again, while the alternative would be more of a flat-lining of the graph. In any case, it looks like the excitement has started:

(click to enlarge)
NEW CAMERAS
CRUNCHED CAMERA REPORT
Our dot of an askance pupil in the great, white eyeball of the frozen north continued to gaze south, wandering southeast to 15.931°E at 9:00 AM, in light breezes of 5-10 mph, before a final lurch west left us at 82.805°N, 15.900°E at noon.
Temperatures fell steadily from -3.1°C at noon yesterday to the period’s low of -6.8°C at 3:00 AM today, before rebounding to the period’s high of -2.8°C at noon. In essence we had the arctic unload over us and down into the North Atlantic. While this export of cold may make the Pole warmer, it doesn’t warm the North Atlantic a bit, nor does a cold Atlantic bode well for Europe’s winter.
The pressure bottomed out when the temperature was lowest, at 999.8 mb at 3:00 AM, and then rose to 1005.5 mb by noon. Some arctic low-pressure obviously passed over. It makes me wonder. Sometimes you see these tight little swirls in the satellite shots, but the models don’t see them at all.
AUGUST 21 —DMI Afternoon Maps—
“Steppenwolf” is complex, with the original Steppenwolf out towards the Pole, a memory of “Berzip” coming up from a Fujiwhara swing underneath to the east, and a piece of “Art” just starting to dive down into the Fujiwhara dance to the west. Joining this fracas is a chunk of “Peg”, coming across the Pole. What a mishmash!
There is still a fairly strong Pacific to Atlantic cross-polar-flow, but it looks like the Pacific end of it is starting to get cut off, and East Siberia is the new source region for the flow. It is still fairly mild in that cold region, with daytime highs in the Kolmya River valley up in the mid 70’s. (24 Celsius) (The Kolmya River is only free of ice from early June until October.) I’d expect air drawn from that region to be mild, but to swiftly lose heat as it moves over water, due to evaporation of the sea’s surface, and then melting of any ice it reaches. (Such phase-changes see available heat become latent heat.)
NEW CAMERAS
Northern camera — It looks like the core of the cold has passed, and fog indicates milder air is arriving. It looks like temperatures have risen from below minus five to above minus one. However it is colder to the south towards Svalbard.
Buoy 2014E: reported -3.64
Conjunct
Buoy 2013F reports -0.11 C at 0000z and -0.14 C at 1200z, which shows even the influx of Pacific air causing us fog hasn’t quite nudged our southern buoy above freezing.
AUGUST 22 —DMI Morning Maps—
The “Fujiwhara Mishmash;” a new dance craze at the Pole. “Steppenwolf” is tugged east to Franz Josef Land as the piece of “Art” swings underneath and “Berzip” elongates towards the East Siberian Sea. The center of this wobbling complex is still forecast to head for Bering Strait, and the flow will swing from Pacific-to-Atlantic around to Canada-to-Siberia. Already the winds at Svalbard as starting to swing to the west.
“Art” continues to sit occluded over Scandinavia, now weak and above 1000 mb, but with additional energy coming into it
via a small low moving through the North Sea. (Off this map.)
Temperatures are much milder than they’ve been, especially on the Canadian side.
NEW SOURCE OF INFORMATION: THE GOOD SHIP POLARSTERN
In my thirst for additional information I came across this research vessel crunching its way towards the Pole. It has a record of the arctic blast moving through the ice-pack north of Greenland, with temperatures dropping below -6.0 C.
I always wonder what it does to the icecap to have these icebreakers slicing through.
A QUICK GLANCE AT THE UK MET
“Art” is up in the Gulf of Bothnia east of Finland, with a whole series of troughs feeding up into it. I guess I’ll call the weak low south of Norway in the North Sea “Artless”. Also notice the isobars at the very top of the map hint at winds shifting to the west.
Here’s some interesting trivia: So many rivers pour into the Gulf of Bothnia that, in its northern reaches, fresh water fish can swim in it. That is why it freezes so swiftly; its water is fresher. The Baltic gets more and more salty as you head southwest towards Denmark.
NEW CAMERAS —the return of gray days—
I expect it will be a while before we see much turquoise and silver. Blame Svenmark’s danged cosmic rays and the Quiet Sun.
Our northern camera has seen warming and is flirting with freezing. To the south it was still cold at
Buoy 2014E: , which was reporting -3.34 C at 0000z. At our northern camera winds are in the 4-8 mph range.
Our southern camera also has been flirting with freezing in 5 mph winds. Currently it dips just below. Back at 0000z conjunct
Interestingly
Buoy 2014C: has now drifted west to a point where it is nearly 200 miles due south of our camera. The ice has thinned to 65 cm and the temperature is at +0.37 C.
A new buoy
Buoy 2014F: has been planted on ice 151 cm thick 77.63 N, 146.01 W, which is nearly due east of our camera, (which is at 77.41 N, 156.57 W) It was thawing to our east, with temperatures at 0000z at +0.17 C. Even further east
Buoy 2012G: at 77.94 N, 125.00 W, was reporting +0.47 C. (Sadly, our buoy just off the north coast of Greenland apparently bit the dust.)
It will be interesting to watch this influx of milder and moister air, to see of it persists, or uplifts and turns into home-grown cold.
It looks like our frozen melt-water pool has a puddle on top of it. So our melt-water has melt-water. The fog looks like it is getting thicker.
CRUNCHED CAMERA REPORT
Our miserly black ant rejoicing across the vast sugar bowl of arctic white continued though the winds slacked off to a complete calm the final twelve hours. Eastward movement ceased at 16.033°E at 6:00 AM, and we drifted back west despite the calm to finish at 82.646°N, 15.928°E at noon. The movement of the ice despite calm was interesting.
Temperatures rose steadily throughout the 12-hour-period, starting at -2.8°C at noon yesterday and finishing at -1.0°C at noon today.
The pressure remained flat, and finished at 1006.2 mb.
AUGUST 22 —DMI Afternoon Maps—
“Steppenwolf” is still moving the wrong way, into Barents Sea, but it still looks like it will be yanked back to the Pacific side by the Fujiwhara effects of both Berzip and the Piece-of-Art. (I’ve danced with people who yank you like that, on Friday nights many moons before this one.) Most of the moved ice is now entering the Barents Sea, as the Pacific-to-Atlantic flow has yet to switch to a Canada-to-Siberia flow. Will it ever? Stay tuned!!!
NEW CAMERAS
At our northern camera temperatures crept back up to freezing under dark and foggy skies. Winds remained light, at 5 mph. No sign of the lead behind the yellow “cork” reopening. I think it may be safe to take a night off.
Milder down at
Buoy 2014E: as well, with temperatures up to -0.89 C. It looks like the arctic has shot its wad, and the first aectic blast of the season was exported to annoy the people of London. Fortunately they have good beer down there.
It was dark and foggy at our southern camera as well, with temperatures at conjunct
Buoy 2013F: only a hair below freezing at -0.02 C. All other buoys over there are just above freezing, except for a bit of a surprise north of Beringinbg Strait, where
Buoy 2014B: is a chilly-1.14 C, though that may hint open water is near. Don’t forget the water the ice rides on is salt, and can be down around -1.5 C.
Have a Great weekend, everyone!
AUGUST 23 —DMI Morning Maps—
There is still no sign of “Steppenwolf” budging from Barents Sea, but models still insist it will be across Kara Sea by tomorrow and the Laptev Sea by Monday, and in Chukcha Sea by Tuesday.
A finger of high pressure will build east from northern Greenland, as a second builds northwest from Poland and Ukraine, and when these fingers meet over Svalbard the high pressure will wall off the Atlantic from the Arctic for a while. It is hard to say whether Steppenwolf is pumping up this ridge, or whether the ridge is bumping Steppenwolf to the Pacific side, but in the long run the high pressure could center over Scandinavia and give them a break from the wallowing occlusions they’ve been living under. First a final blob of “Art” will have to be squeezed east of Finland into the Steppenwolf Fujiwhara fracas, and the rest of the Baltic low pressure will have to be squashed south. If all goes according to plan then, in a week, Scandinavia will have utterly different weather.
This new wall of high pressure across the north Atlantic will have Canada-to-Siberia winds on its side facing the Pole, which will mesh with Steppenwolf’s winds, and either spread out the ice towards open waters, or have me banging my head against the wall by refusing to do so. (How’s that for a forecast?)
NEW CAMERA —Recharging the cold—
The Pole is much warmer than it has been, with most of the subfreezing air towards the European quadrant. Our northern camera continues to see fog and temperatures close to freezing, with winds slacking off to nearly calm. Humidity has pegged out at 100%, so there is little heat-loss due to evaporation, and likely heat-gain due to condensation. To the south
Buoy 2014E: is reporting -0.47 C, and is actually the only buoy reporting subfreezing temperatures. We exported all our cold air to western Europe, and it will take a while to build up some more.
Our camera shows no sign of thaw yet, but it wouldn’t surprise me to see the two small melt-water pools reappear in the left middle-distance. (By the way, they have updated the film they make by splicing all these pictures together. The final 3 minutes is worth watching, to see how the ice in the background does shift left and right, even if it hasn’t done so for the past ten days. This ice has the potential to spread out, even if it doesn’t do so in reality.) http://obuoy.datatransport.org/monitor#buoy9/movie
Our southern camera is scanning a scene of thaw, now that the thaw is suppose to be over. Conjunct
Buoy 2013F: is reporting + 0.24 C, and all the other buoys on this side of the Pole are reporting a quarter or half degree above freezing, during the “warmth” of afternoon. This far south the sun dips very low at midnight, and we are at the verge of seeing the midnight sun give way to the midnight twilight. Winds are light at our foggy camera.
(I need to find some Russian buoys on the Siberian side. Surely they exist, though perhaps they are not as public with their reporting. )
They’ve updated the movie at this camera as well. Watching it shows how it did try to thaw this summer, but the thaws kept suffering setbacks. http://obuoy.datatransport.org/monitor#buoy10/movie
CRUNCHED CAMERA REPORT
Our little blackbird amidst a huge flock of swans continued slowly south, wandering as far west as 15.718°E before turning back east to end the 24 hour period at 82.528°N,15.942°E. Winds were reported as calm throughout the period, which makes me suspect the anemometer is frozen up. (It happens, in freezing fog, when the wind is calm just long enough for rime to build up.) We need a spell of above freezing temperatures to be sure the calm is genuine.
It didn’t happen for yet another day, as temperatures were flat. The high was at the start of the period at noon yesterday, -1.0°C, and the next reading was the low of -1.4°C which persisted until midnight, and then was followed by a nearly imperceptible rise to -1.2°C at noon today.
The barometer ended the period close to where it started, at 1006.4 mb.
AUGUST 23 —DMI Afternoon Maps—
“Steppenwolf” is now hurrying across the northern Kara Dea, apparently following s front or trough that “Berzip” plowed into the Pacific side. Things are proceeding as “planned,” so far.
A disconcerting low has appeared off the east coast of Greenland; you’ve got to watch those sneaky suckers.
Also some surprising home-grown cold has appeared off the Canadian arctic coast.
It looks like we are about to say “Good-bye” to the Pacific-to-Atlantic flow.
BARDARBUNGA VOLCANO IN ICELAND GRUMBLING
It sure looks like an eruption has started, but there is some dispute about whether this is merely dust from earthquakes or some other such thing. Perhaps the swarm of earthquakes under this part of Iceland is much ado about nothing, but it should be watched. Rather than a single cone, this volcano has a history of splitting the skin of the Earth with a long crack, and producing a long line of fountaining lava which can be many miles long. This volcano also holds the record for the most lava produced by a single eruption, over the past 10,000 years. (The eruption occurred over 6000 years ago, so I can’t supply photos.)
Currently it is topped by a thick icecap, but that could melt in a hurry.
It will provide me with a convenient excuse for botched forecasts.
MORE POWERFUL THAN VOLCANOES—AMO AND PDO
What really effects the amount of arctic sea-ice is the Atlantic Multidecadal Oscillation, or AMO, and the Pacific Decadal Oscillation, or PDO. To simplify greatly, when they are “warm” there is less ice. I put the word “warm” in quotes because it is not that the entire ocean is warmer as a whole, but rather that the warm water is located in a position where it effects the arctic more. In both oceans the “warm” phase is seen as a backwards letter “C” of warmth in the northern half of the ocean, with the curve of the “C” nudging California in the Pacific, and northwest Africa in the Atlantic. (In actual fact each “warm” phase has attributes all its own, but I am speaking in generalities.)
The PDO has shifted to its “cold” phase, and right on cue there was an increase of ice around Bering Strait, on the Pacific side of the Pole. However there can be short-term spikes to “warm” in the “cold” phase, which we are now seeing, and which also occurred in the 1950’s during the last “cold” phase. This warmth is largely focused in the waters southwest of Alaska, (which is a phenomenon that Joseph D’Aleo has noted gave the eastern USA a very cold winters in 1917-1918.) Again right on cue there was less ice in Bering Strait,especially in the first half of last winter.
Meanwhile the AMO has been in its “warm” phase, and has 5-10 more years before it switches to “cold,” however it too switched to a short-term spike, to “cold”, last winter. Right on cue ice started to expand on the Atlantic side, but now that spike is ending and the AMO is moving back towards “warm.”
5-10 years from now, if both the AMO and PDO are locked into “cold” phases, we might expect sea-ice to increase, however there may be a fly in the ointment.
The reason a chaotic system can produce orderly shapes such as the spiral of a hurricane (or a 60-70 year cycle) is partly a mystery that Chaos Theory seeks to better understand, and partly due to factors we do understand. For example, in the case of a hurricane we do understand things such as lapse rates and the Coriolis Force, and some meteorologists do a surprisingly good job of taking what we know and predicting what such temperamental storms will do. However hurricanes still often surprise us, due to the more mysterious and wonderful side of chaos. We are, after all, dealing with a nearly infinite number of variables.
In the case of the AMO and PDO we are only starting to understand the knowable side of the chaotic system. The very existence of these cycles wasn’t known by most meteorologists when I was a boy (though some had hunches such cycles existed.) Our best guesses about the knowable side in the year 2014 will likely look laughable in 2024, but at this point the 60-70 year cycle seems something like a heartbeat’s “flub-dub.” The Pacific supplies the power-stroke and the Atlantic is a responsive follow-up stroke, primarily because the Pacific is so much bigger.
It takes order from outside to create a heartbeat, and the order is supplied by nerves supplying orderly micro-shocks. In the case of the 60-70 year cycle the outside influence is likely regular patterns such as the yearly seasons, and the somewhat regular sunspot cycle, however our knowledge of such outside-influences is still in its infancy.
Now here is the fly in the ointment. Just as the beautiful order (from afar) of a hurricane falls apart and turns back into chaos as the storm weakens and fills, the beautiful order of our own heartbeat can go into a state we don’t find the slightest bit fascinating, called fibrillation. The timing of the micro-shocks gets out of whack, and the familiar “flub-dub” we take so for granted becomes a chaotic system.
Assuming the 60-70 year cycle is likely governed by the regularity of outside influences, one wonders what sort of irregularity could throw the cycle into a sort of fibrillation. Dr. Tim Ball has suggested a huge volcanic eruption, such as Tambora in 1815, can cause extreme meridianal jet streams. I myself am now wondering what effect the “Quiet Sun” might have.
Considering we don’t really understand the 60-70 year cycle to begin with, it might seem the last thing we need is for the cycle to start acting all weird on us. However I prefer to look at it as a challenge. After all, the Creator made us a universe with infinite variables and more types of chaos than there are grains of sand on a beach, yet creation seems to do a pretty good job of running itself even when we can’t fathom it. We are stuck in the middle of swirlings of stars, and to attempt to fathom it all is simply a form of appreciation. Furthermore, it is in our attempts to fathom it all that we can awaken our sense of wonder, and even joy.
AUGUST 24 —DMI Morning Maps—
AUGUST 24 —DMI Afternoon Maps—
AUGUST 25 —DMI Morning Maps—
The above maps do a good job of showing the Pacific-to-Atlantic flow swinging around to become a Canada-to-Siberia flow. This counterclockwise motion will continue until we arrive eventually at a Atlantic-to-Pacific flow, which demonstrates how fickle things are in the Arctic, especially as seasons change.
The above maps also show the two fingers of high pressure joining over Svalbard and effectively blocking the inflow of Atlantic air, and the outflow of Arctic air. With a similar situation developing on the Pacific side, my hunch is that the isolated air over the Pole will lose heat and a reservoir of cold will grow. The primary inflow seems to be from Siberia, and even though such air is still mild it is dry and a lot of radiational and evaporative cooling occurs when it gets over arctic waters.
The Svalbard high pressure will have a struggle pushing the wallowing low pressure from Scandinavia, especially as a reinforcing low looks like it will loop back from towards the Black Sea to southeast Finland and stall. It still looks like high pressure will work down over Scandinavia by next weekend, but rather than east winds from the still relatively-warm Steppes the winds look like they will be north from the arctic, especially over Norway, and the sunshine will be cool.
I’ve been busy and haven’t had time to pay as much attention as I’d like, so I have no idea where the low on the east coast of Greenland came from. I’ll call it “Owtada,” which is derived from “Out-of-the”, because as far as I’m concerned it came out of the blue. It is kicking a zipper (off this map) across the Atlantic towards Britain, which I’ll call “Outadazip.” As that extension goes south of the building high pressure Outada will squeeze north, and may advance on the Pole as “Steppenwolf” heads into Bering Strait or Alaska.
However for the next few days “Steppenwolf’s” polar passage will be the focus. If it doesn’t spread the ice out into the Kara and Laptev Seas I’m going to have to rethink my ideas. Of course, that isn’t the slightest bit unusual.
NEW CAMERAS
Our northern camera hasn’t updated since the 21st. It took me a while to catch on to the fact I was posting the same picture over and over. Temperatures took quite a plunge, to around minus five, but have since returned to flirting with freezing. Winds have picked up to the 10-15 mph range. We remain at around 88 degrees north, but have swung around and crossed 90 degrees longitude, so we are now officially on the Atlantic side of the Pole. I sure hope they can fix the camera.
The cold air has migrated south with the last push of the Pacific-to-Atlantic flow, and
Buoy 2014E reported -4.45°C at 0000z this morning. Even further south our crunched camera reports a steady -1.30°C, which is close enough to the temperature of the sea-water down there to make me wonder if that buoy is afloat.
Meanwhile our southern camera has also flirted with freezing, but recently has been on the cold side, and it looks the melt-water puddle atop the frozen melt-water pool has refrozen. Conjunct
Buoy 2013F: has gone from -0.21 C at 1200z yesterday to -0.22 C at 0000z this morning, despite the fact the sun rises from the hozon to its highest in this time period, and all other buoys in the area are showing a drop in temperatures despite the daylight. Either they forgot to update the temperatures, or colder air is arriving ahead of the advance of “Steppenwolf.”
I’m glad this camera is working, for the storm could break up the ice.
AUGUST 25 —DMI Afternoon Maps—
NEW CAMERAS —Northern Camera is fixed—
CRUNCHED CAMERA REPORT
Our crunched camera may now be sitting at the bottom of the deep blue sea, as the weather-buoy it looked upon floats freely a mile above, bobbing midst bergs and lapping slush. I base this on the fact we’ve had no wind reported for two days, which sometimes is a sign the anemometer is encrusted with frozen spray. Also the temperature has stayed very flat and is close to the subzero temperature of the seawater down there.
For the past 46 hours our movement (if not straight down), has been slowly but steadily south, in a serpentine manner, east to 15.970°E at 3:00 PM Saturday, west to 15.877°E at midnight, east to 16.009°E at 6:00 PM Sunday, west to 15.956°E at 9:00 PM, and then east to 16.196°E at noon today (Monday.) This sort of slow motion is indicative if calm conditions, especially if we are freely floating.
The barometer also suggests calm, very steady, starting at 1006.4 mb and only sinking to 1004.7 mb in 48 hours.
As I said the temperatures have been flat, never varying between -1.2°C and -1.4°C until the final reading, when we rose a whole tenth of a degree to -1.1°C. If we can get above freezing for a while our anemometer may start working again.
AUGUST 26 —DMI Morning Maps—
“Steppenwolf” has moved north of the Laptev Sea, and its west-side north winds should start to dump sea-ice southwards. Also the notch of open water extending north of the Laptev Sea may get filled in. (It is an interesting feature, likely due to the fact the Laptev Sea had so little ice to begin with this year, and also likely to freeze over swiftly and early, as it reaches further north than usual, and temperatures begin to plunge at the Pole at this time.) I think the trough of low pressure being swung around towards the Pole may be a remnant of “Berzip.” I’m watching to see if it generates cold air as it fills.
The Atlantic is still blocked by high pressure, but “Owtada” lurks off the east coast of Greenland. The low looped back from the Steppes to southeast Finland; I’ll call it a reincarnation of “Artless.” An off-the-map low has crossed the Atlantic, “Owtadason,” and it will swing under and tug “Artless” away to the east, allowing high pressure to move in from the west over Scandinavia. As that high pressure centers on the east side of the North Atlantic it will allow “Owtada” to squeeze north along the east coast of Greenland and head for the Pole next weekend.
The low pressure over the Pole is fueled by rising air, and that means milder-than-normal temperatures for the first time in a long time on the DMI graph. However storms seem to lose heat up there, and as they fill it gets colder, so I’m expecting to see a sharp downturn in the graph.

(Click to enlarge)
For very selfish reasons, involving the fact I made a forecast that is going down in flames, I am disappointed in the DMI “extent” graph. I was expecting more of an up-tick in the graph than this piddly little one.

(Click to enlarge)
NEW CAMERAS —A Time of Storms—
Our northern camera either is in the middle of very thick fog, or freezing fog has messed up our lens. If it is the latter we will have to wait for bright sun or thaw to see anything. (If they have a lens-heater, I doubt they will use the battery, as it is harder to recharge with the sun low, especially as it is cloudy.) There is a swirl of thaw towards Canada that might come our way. I assume the clouds are the remnants of “Berzip” being swirled around over the Pole by “Steppenwolf.” Temperatures are steadily at a degree or two below freezing, with winds in the 8-12 mph range.
Down at
Buoy 2014E: temperatures were down to -4.45 C at 1200z yesterday, but rose to -0.78 C at 0000z.
Our southern camera sees a bleak and gray scene with subfreezing winds of 15-20 mph as they await the arrival of “Steppenwolf.” Conjunct
Buoy 2013F: has seen temperatures fall from -0.22 C at 1200z yesterday to -2.47 C at 0000z today, despite the sun rising up to its daytime high, beyond the clouds. I assume this cold has swirled in from the west, for
Buoy 2014B: over in that direction saw a more normal rise during the same period, from -1.79 C to -0.48 C. To our east
Buoy 2014F: also saw a normal rise, from -0.89 C to -0.15 C, however to our south
Buoy 2014C: was apparently hit by the same pocket of cold that hit our camera, as temperatures fell from -0.68 C to -2.18 C. That camera won’t withstand much punishment from “Steppenwolf”, as the ice down there is only 52 cm thick; at our camera it is a more hefty 136 cm.
I wonder if that pocket of cold was a creation of “Berzip,” and is being swung around in the lee if it.
AUGUST 26 —DMI Afternoon Maps—
Things are pretty much proceeding “according to plan”, with “Steppenwolf” moving towards Bering Strait, high pressure blocking the Atlantic, the low “Artless” stalled over southeast Finland, and “Owtada” lurking east of Greenland.
What isn’t obvious, but is interesting, is that blob of cold we saw passing our southern camera. It is swinging around the Pole towards our northern camera. Both the GFS and JEM models now see it, and have it be briefly a large pool of cold right over the Pole, before squashing it out into a long thin noodle of cold as “Owtada” comes north and an Atlantic-to-Pacific flow gets going.
Temperatures drop very swiftly as September starts, at the Pole. Models see temperatures in the single digits (Fahrenheit) (below -13 Celsius) in 144 hours.
“Steppenwolf’s” winds should be pushing ice south into both the Kara and Laptev Seas for the next 26 hours. If it doesn’t happen I’ll have to rethink my ideas about how ice moves. (Please notice how I rethink my personal theory, rather than “adjusting” the data to make my theory correct.)
NEW CAMERAS —CLEARING NORTH; STORMY SOUTH—
The frost is likely sublimating off the lens of the northern camera, as it hasn’t been sunny enough or warm enough to reduce it, yet it is reduced. It hints at clearing skies, which will breed cold, as the sun is too low to warm like it did in July. What is more, that blob of cold we noticed passing by buoys near our southern cameras is heading our way.
Wind have slacked off to the 5-10 mph range, and temperatures are around minus two. Further south they were at -1.45 C at 0000z at
Buoy 2014E:, and at our crunched camera they were at -1.3°C.
SOUTHERN CAMERA HAS WINDS 18-23 MPH. DUST OF SNOW ON MELT-WATER POOL.
The blob of cold has moved east of our camera, as conjunct
Buoy 2013F: is at -0.44 C, further east the new
Buoy 2014F: is at -0.96 C, and even further east the old veteran
Buoy 2012G:, at 77.88 N, 124.29 W, is down to -2.11 C.
CRUNCHED CAMERA REPORT
I checked out the view from the satellite, and the sea still looks packed with ice by our weather buoy. Even if our crunched camera is sunk, the weather bouy can’t float very far from where the camera would have been, had the ice not been crunched.
In this 24-hour period our southward progress came to a halt at midnight, at 82.362°N, even as our eastward progress, which had halted at 16.255°E at 6:00 PM yesterday, again resumed, after a regress to 16.255°E. As we continued east or northward regression only made it to 82.374°N, before we started creeping south to wind up at 82.369°N, 16.569°E.
Our anemometer is still reporting no wind. Either it is frozen up, or perhaps out buoy is tipped on its side. Temperatures remain close to that of seawater, so perhaps the buoy is upside down. Temperatures remain between -1.1°C (noon yesterday) and -1.1°C (noon today.)
Pressures fell slightly, from 1004.7 mb at noon yesterday to 1001.
4mb at noon today. This surprised me, as I was expecting the blocking high pressure over Svalbard to show a rise. Instead we may be seeing the first signs of the advance of “Owtada.” If that low does come north we may spend time in a windy and relatively warm flow from the south, which will bring thaw and remove doubts about the state of out anemometer. Also it will push us away from Svalbard, which is a pity, as I was looking forward to a visit.
LOCAL VIEW —School Is Starting—
It has been a while since I’ve added one of these “Local Views.” That is because I get quite enough of reality as it is, and turn to Sea-ice as an escape, and a journey into wonder and joy. I am still like I was as a boy in Algebra class, where the chalked reality was a strange poison, and the the antidote was the clouds out the window. School stunted me, and summer vacation was a wonderful time of healing. Teachers were always telling me I needed to face reality, and shouldn’t withdraw, but it sure didn’t look like reality had done them much good. It seemed to me the farrther I could withdraw, the better, which likely explains how I wound up on the North Pole.
However reality does rear its ugly head, and I do work a real job to earn real money. (Please notice this site has no “tip jar” to wheedle your hard earned loose change from your pockets.) I am a “child care professional”, which means I am basically a baby-sitter for parents half my age. They too work real jobs for real money, and need decent people to watch their children as they do so.
It would be so much easier if there wasn’t people in the other-world called “school” who seem to see parents as being in the way, and only useful as overnight babysitters, and producers of tax-dollars. They do things such as start school before Labor Day, and institute Half-day Kindergartens, which disregard reality a whole lot more than I do, even though I am a confirmed dreamer.
First, to start school before Labor Day means you intrude upon the lazy, hazy, crazy days of summer with stuff like Algebra, and if it is difficult to teach Algebra on a gray day of pouring rain, it is much harder in a heatwave, such as this map shows the start of school will know:

(Click to enlarge)
Looking at that map, any decent dreamer would notice the hurricane south of me. That is a danger and should be a focus, but it likely will go out to sea, and be starting to concern our sea-ice considerations as it charges Iceland next Sunday. However if you are a parent you need to consider getting your kids to school in a heatwave.
To help parents out our local schools decided to institute half-day kindergarten. Talk about a foolish idea! Working parents don’t work half-day jobs. Who the heck is to get off work, and drive to the school, and drive their the “child care professional” for the afternoon? To help parents out, my wife and I said we could do the driving. So many parents jumped at our offer we had to sell our old vehicle, that could carry three children, and buy a van that could carry six. After that we had to turn other parents away. We can only do so much, with our limited resources.
To make sure we had things covered, we bought a van that had tires you can drive a hundred miles, even when they are punctured. We also invested in a “roadside assistance” plan. So things were looking good.
However our roads are in sorry shape, as our government invests billions into Global Warming but less into our roads. A truck slamming over potholes shed a sharp shard of metal, my wife drove over it, and we discovered those newfangled tires can very swiftly get as flat as old-fashioned tires. We also discovered roadside assistance can’t always assist before noon the next day.
So that is my predicament. Tomorrow is the first day of school, and we have six small children to transport to Kindergarten, and no van until noon, when we should have already picked them up.
Hopefully you will understand if, in tomorrow’s 90 degree heat, I post less than usual.
AUGUST 27 —DMI Morning Maps—
The minus-five isotherm has appeared for the first time close to the Pole. Everything else is about the same, but there is more of a weakness northeast of Greenland to allow “Owtada” north.
NEW CAMERAS
Wow! Temperatures crashed at our northern Camera! Down nearly to minus ten. Winds are down to 5-10 mph. Humidity has dropped to 80%, which is low for the Arctic Ocean in the summer. If Owtada brings Atlantic moisture north, there could be quite a clash with this bitter cold air. Enjoy the sunshine, while it lasts.
Notice our melt-water pools have been hidden by windblown snow. The ice is showing no signs of cracking up.
Our southern camera has seen winds drop off to 4-8 mph, with temperatures just a hair below freezing.
AUGUST 27 —DMI AFTERNOON MAPS—
NEW CAMERAS
Our northern camera has stopped transmitting postures, once again. However temperatures only made it up to minus five before dripping all the way to minus ten, and the humidity is only back up to 90%, so I imagine the view is still stark and sunny. Winds are at 5 mph.
Our southern camera continues to flirt with freezing, but remain just below. Winds have slacked off to a light air of 4 mph. Conjunct
Buoy 2013F came in at -0.27 C, and all other buoys came in below freezing but above minus one.
AUGUST 28 —DMI Morning Maps—
“Steppenwolf” is starting to fade, as a weak “Owtada” makes its move toward the Pole from Greenland. Between them and high pressure towards Eurasia an Atlantic-to-Pacific flow is completely reversing the Pacific-to-Atlantic flow we saw a few days ago. However as “Owrada” is largely from northern source-regions, it will not bring any real Atlantic juice north, and south of it strong west winds look likely to slam the door on Atlantic invasions, in the short term. For the time being what happens in the arctic stays in the arctic.
“Artless” is getting pushed east of Scandinavia as high pressure builds erst of Scandinavia.
There is very cold air over the Pole itself, shown by the island of minus-five isotherms. It is actually beliw minus ten at our northern camera.
NEW CAMERAS —Snow to south, cold to north—
Our northern camera is still failing to transmit pictures, but the weather station informs us winds remain light, at 4 mph, and humidities remain low (for the arctic) at 89%, and temperatures raise an eyebrow, remaining below minus ten. Further south towards Svalbard it is not so cold, as
Buoy 2014E: reports -1.64 C.
Our southern camera shows Steppenwolf brought enough of a dusting of snow to nearly hide out melt-water pools, which are largely frozen over. Winds are nearly calm, and temperatures are dipping a little further below freezing.
NORTHERN CAMERA SENDING PICTURES AGAIN
Temperature -7.0 and rising; Relative humidity still relatively low.
CRUNCHED CAMERA REPORT
It may appear our weather buoy is moping about the sinking of the camera, for once again the anemometer behaved encrusted, and reported no wind, and again temperatures did not vary much over 48 hours, as if the thermometer is tilted just above sea-water, (our low was -1.4°C at midnight yesterday and out high was -0.9°C at noon today), and what’s more the GPS didn’t show us getting anywhere. Over 48 hours the barometer described as slow, boring and fitful rise, to 1008.9 mb.
The GPS showed us taking 12 hours to drift .008 degrees south to 82.361°N, and all that work undone by the next report, and then we continued north to 82.383°N at 6:00 PM yesterday, then south to 82.375°N at 9:00 PM, and then north to 82.418°N at noon today. Meanwhile we drifted east to 16.681°E, west to 16.599°E, east to 16.740°E, west to 16.731°E, east to 16.745°E, west to 16.611°E, and finally east to end the 48 hour period at 82.418°N, 16.739°E. That’s a heck of a lot of work to wind up basically five miles from where you started.
Though it appears that our buoy is sulking, I have the benefits of a lively imagination which in this case is freed from the constraints of having an actual image from an actual camera to keep me grounded, and therefore I can tell you what the evidence is actually pointing to. It is incredibly exciting.
What actually happened was that, as our camera sunk, it became entangled in the tusk of a narwhal, which began leaping about in the open water between bergs, desperately attempting to free itself from the encumbrance. At this point Climate Scientists, seeing there was a chance to save the camera if only they could maneuver a berg beneath the narwhal as it leaped, began releasing CO2 at various locals, demonstrating once again their ability to control the climate and even arctic sea-ice. Unfortunately the narwhal is slippery, and they haven’t quite caught it yet, but the motions of the sea-ice shows how hard they are trying.
AUGUST 28 —DMI Afternoon Maps—
NEW CAMERAS
AUGUST 29 —DMI Morning Maps—
“Steppenwolf” is starting to fill north of Alaska as “Owrada” brings a pocket of milder air up towards the Pole. As “Owtada” becomes the larger low the Atlantic-to-Pacific flow will continue to swing counter clockwise and start to become Siberia-to-Alaska. Less spreading-out of ice occurred than I foresaw, and the “extent” graph only slowed its decent, and did not “flat-line.”

(click to enlarge)
There is more ice than last year, and we are definitely not in a “Death Spiral,” but the ice didn’t recover to the degree I thought mostly because the AMO didn’t remain “cold” as long as I thought it would, and the packed ice didn’t spread out.
The gale that blew up by Greenland’s southern tip, (“Tip”), is a sign of things to come. As autumn shortens the days we see little waves turn into gales with amazing speed in the North Atlantic. (“Bombogenesis.”)
NEW CAMERAS —Warmer north; Colder south—Light winds—
TAVURCUR VOLCANO ERUPTS IN NEW BRITAIN, NORTH OF AUSTRALIA
While watching Iceland carefully for an eruption, this goes off behind my back. Ash is up to 50,000 feet, which isn’t high enough to be a major weather-changer so far, though it may disrupt air travel.
CRUNCHED CAMERA REPORT
Our anemometer continues to report no wind. I hope it is merely encrusted in rime, like a spruce atop a cloud shrouded hill when temperatures are below freezing. (The alternative is that we may soon issue a “Crunched Weather Buoy Report”.) We need a spell of above freezing temperatures to melt it free. Perhaps Hurricane Cristobal will bring some such warmth our way next week.
Temperatures continue to suggest open water is near, remaining fairly flat and near the temperature of the surface salt water up there. Temperatures did slightly perk my interest by soaring to an unprecedented (in the past week) high of -0.8°C at 6:00 PM yesterday, but then slumped back to a boring, old -1.3°C by noon today.
Judging from satellite shots, we remain in waters packed with ice, and open water remains to our south by the northwest coast of Svalbard. We are moving the wrong way, if we want some clear sailing down there, for the GPS informs us we slowly drifted north to 82.435°N, before starting south again. However we also need to head back west to avoid crashing into Svalbard, and we only managed a single westward jolt, back to 16.806°E at 9:00 PM yesterday after reaching 16.847°E at 6:00 PM, before continuing east to end our travels at 82.420°N, 17.107°E. The slowness of our drift suggest winds are light.
The barometer has been falling as “Owtada” passes to our west, down from 1008.9 mb at noon yesterday to 1005.7 mb at noon today.
AUGUST 29 —DMI Afternoon Maps—
Noon is at the bottom of these maps, at six o’clock, while midnight is at the top. The coldest dark-before-dawn is over at ten o’clock, near the Canada-Alaska border, and you can see a pool of colder isotherms there. The warmth of the afternoon is at five o’clock, over Franz Josef Land, and you can see a pool of warmer isotherm there. That being said, you start to notice things that don’t fit diurnal variation. It should not be so cold in the east of the Kara Sea and west of the Laptev Sea. It should not be so warm north of the Canadian Archipelago, nor so cold just north of Greenland.
“Steppenwolf” is starting to fill, north of Alaska, so I am watching to see if cold builds there. “Owtada” is bringing a glob of warmth to the Pole, (any temperatures above freezing start to be unusual up there, around now.) I am watching to see if that warm air uplifts, vanishing from the surface temperature map but feeding Owtada, and allowing air to circle around the Pole rather than exiting or entering. High Pressure is building and walling off the Atlantic, (and giving Scandinavia a break,) and the Atlantic is where we are watching the waters south of Iceland for the appearance of Hurricane Cristobal, which I will call “Tobal,” (for it is the end of Cristobal.)
NEW CAMERA REPORT
The northern camera still looks across a gray world, with temperatures still cold, though they did rise up to around -2.5 briefly, and winds still light, around 4-8 mph. However the closest pressure ridge shows signs of activity.
Likely this is due to the fact “Steppenwolf” and “Owtada” are like two counter-clockwise gears, and with no clockwise high pressure between them they are gears that grind. Sea-ice pushed Canada-to-Siberia by Steppenwolf is ice that is pushed Siberia-to-Canada by Owtada. Something has to give, so, even when winds are light, the various fault-zones between plates of ice become active. With strange squealing and moaning sounds, the ice starts to move.
Our southern camera sees skies starting to clear and cold starting to build, as Steppenwolf weakens and fades. Conjunct
Buoy 2013F: was coming in at -3.74 C.
AUGUST 31 —DMI MORNING MAPS—


“Steppenwolf” continues to fill, as “Owtada” retains its identity, as things briefly go as I expected, before utterly baffling me by doing stuff I didn’t expect. Right now the filling of Steppenwolf does seem to be creating cold, as our conjunct
Buoy 2013F: reports -4.06 C,
Buoy 2014B: to the west, now north of Wrangle Island, reports -2.03 C,
Buoy 2014C to the south of our southern camera reports -2.12 C, and new
Buoy 2014F: to the east reports -1.02 C. However when you travel further east, to old
Buoy 2012G: north of westernmost Canadian Archipelago (where temperatures are often coldest this time of year) we see a surprisingly mild +1.11 C. This represents “fuel” for Steppenwolf, which should lead to it restrengthening, even as “Owtada” which I thought would take over as the boss, runs out of gas and fades and is absorbed south into a low south of the Kara Sea. Hmm. What is the name of that low? Is it “Artless? With “Owtadazip” added in? I think so. And that would make the little low kicked ahead into the Laptev sea “Artlesszip.” Artlesszip will bring another bit of fuel up into “Steppenwolf”, which also might be supplied bu a third inflow from the pacific. In any case “Steppenwolf” will swirl around north of Bering Strait longer than I thought it would.
Meanwhile I’m awaiting the attack of “Tobal” (the remnants of Hurricane Cristobal) from the bottom of this map.
A sneak peek at UK Met Maps—Watching what “Tobal” is forecast to do—
These four maps represent the initial Saturday maps, and then the forecast maps for Sunday, Monday and Tuesday. We begin with the North Atlantic blocked, and what I guess I’ll call “Owtadason” and A”Outadathree” bogged down and going no where, as “Tobal” (the extratropical Hurricane Cristobal) charges north. As Tobal crashes into Iceland and gets stuck it creates a southwest surge up the west coast of Norway. This represents a major invasion of the arctic. Will it charge the Pole? Or will it (as often happens) take a right turn and go surging east along the arctic coast of Eurasia? Stay Tuned!!!
SAT
SUN
MON
TUE
Notice the high pressure protecting Scandinavia (except Denmark) getting nudged east.
Some like to scrutinize such maps for hints of the “winter pattern.” While this southwest surge does look a bit like last winter’s pattern, it is important to remember that the patterns of September are “transitional,” and often the transitional pattern is the opposite of the following winter’s, in many ways. In fact, in North America, you often get a better idea of winter’s pattern by looking at July than at September. I’m not so sure this applies to Europe. (The problem being that the AMO has changed from “cold” to “warm,” and a change that dramatic can overrule other “general rules.”)
NEW CAMERAS —Northern Storm and Southern Sunset—
Our northern camera remains cold, with winds picking up to 10-15 mph. To the south towards Fram Strait,
Buoy 2014E: had chilled to -3.56 C.
The southern camera shows us twilight, and then a free bonus picture of sunrise, as the days of 24-hour-sunshine have ended down at 77 degrees latitude. Now begins a long, long sunset. Temperatures have gotten colder as “Steppenwolf” has weakened. Winds have picked up slightly from a dead calm to the 5-10 mph range.
Notice that all the familiar features of our melt-water pool have been obliterated.
CRUNCHED CAMERA REPORT
Our calamitous collection of compromised equipment continued east-southeast throughout the 24-hour-period, and wound up at noon today at 82.259°N, 17.829°E. This places us some 125 miles north of Svalbatd, roughly halfway across the top. Further eastward progress will be difficult, as the ice northeast of Svalbard is densely packed, and extends down Svalbard’s east coast, giving Barents Sea 50,000 km2 more ice than is usual for this late in the summer.
The barometer was very steady, at 1005.7 mb at noon yesterday and at 1005.6 mb at noon today. Temperatures constantly read -1.3°C, which suggests we may be reading the temperature of the seawater and not the air. The anemometer remained stuck, reporting no wind, Hopefully it isn’t bent, after colliding with another iceberg.
AUGUST 30 —DMI Afternoon Maps—
NEW CAMERAS
Our northern camera has seen temperatures moderate up towards freezing as “Owtada” brings moisture and mildnness north, and it clashes with the cold air it is displacing and gives us a gray scene. Winds have slackened from around 15 mph to around 10. Down to the south at
Buoy 2014E: it is colder, at -2.42 C, which suggests cold air has been swirled around and Owtada is now in effect a warm-core storm. I expect that warmth to uplift and soon vanish from ground-level maps.
Our southern camera has seen winds increase to the 10-15 mph range, as temperatures have recovered from sunrise lows down around minus-seven to around minus-two. At 0000z the sun is high at our southern camera, and conjunct
Buoy 2013F: was reporting -2.27 C, and temperatures will likely now go down as the sun goes down, because the sky appears fairly clear. (Some low clouds did move through today.)
AUGUST 31 —DMI Morning Maps—
It is noon at the top of the maps, with the sun at its highest, so the “warmth” of the arctic day should be at its height. “Steppenwolf” is swinging a wave of cold east along the arctic coast of Canada, but also slurping up some milder air from the normally-cold Canadian Archipelago. The old veteran
Buoy 2012G: continues to stand alone with above-freezing temperatures, up at +1.98 C at 0000z (which is the same time as these maps.) This warmth will revitalize Steppenwolf.
Steppenwolf will likely absorb the little Laptev low “Artlesszip”, (but it is those little lows that most mess up the computer models, so keep an eye on it.) Meanwhile Owtada will fade and fill and be absorbed south from the Pole into the low “Artless” inland, south of the Kara Sea. As Steppenwolf and Artless consolidate to separate centers the converging winds around their perifery will build a high pressure over the Pole. (It makes better sense to have a clockwise gear between two counterclockwise gears.) This high will likely be cold, and will likely deflect east the warmth rushing north with “Tobal”, now appearing at the bottom of the map.
The above-freezing isotherm-pockets brought north to the Pole by “Owtada” have vanished from the map.
NEW CAMERAS —Snow at Pole—
The northern camera shows the yellow “cork” is wearing a cap of fresh snow. The mild above-freezing air brought north by “Owtada” rose, released latent heat as it condensed and then froze, and obviously left that latent heat aloft as it came back down as subfreezing stuff called “snow.” (How much of that latent heat is lost to outer space is a matter of debate.)
Winds have slacked off from 10-15 mph to light airs of 2 mph, as temperatures continue just below freezing.
Our southern camera shows a cold scene of blue twilight with no thawing. The cold we saw yesterday has likely been swirled east, as temperatures haven’t fallen as much with this twilight, only down to -2.5 C rather than -7.0 C. Winds are light, in the 2-5 mph range.
ICE EXTENT GRAPH SHOWS UPTICK
I’ve noticed these upticks are often associated with snowfall in the arctic. I suspect the Satellite may see slushy water as “open” water, but as soon as the slush is coated with a dust of snow the same area is seen as “sea-ice.” (The snow doesn’t melt when it hits, as it is fresh water with a melting point of zero, and the slushy water holds salt and is at a temperature -1.3 to -1.9, depending how brackish or briny it is.) It should be noted that when the salt in the sea-water melts the fresh-water snow, it gets colder, just as ice-water gets colder when you add salt to an ice-cream-maker. Not only does available heat become latent heat in the phase change, but a little more heat is lost as fresh water becomes salty.
The uptick puts our extent above last years, and that much farther from the “ice-free-Pole” we were promised by the proponents of the “Death Spiral.”
A discussion of this news is occurring at http://wattsupwiththat.com/2014/08/30/the-arctic-sea-ice-spiral-of-death-seems-to-have-reversed/
CRUNCHED CAMERA REPORT
Alas! There is no report today! Has our battered buoy met its match?
AUGUST 31 —DMI Afternoon Maps—
“Steppenwolf” retaining strength north of Bering Stait, as “Owtada” weakens, while small bubble of above-freezing isotherms shows “Owtada” is still a “warm-core” storm. “Tobal” is a gale, approaching Iceland. Formerly “warm” inflow from Canadian Archipelago now confused, with cold mixing in. “Artlesszip” shrinking to insignificance over Laptev Sea. “Artless” is fairly large, inland south of Kara Sea.
NEW CAMERAS
Our northern camera witnesses light airs of 2 mph, falling temperatures of minus five, and a gloomy, gray world of ice-fog. The light winds are keeping the motion of the the ice at a minimum. Down towards Svalbard,
Buoy 2014E: at 83.56 N, 6.12 E was also cold, reporting -2.97 C.
Our southern Buoy is seeing nothing, as it has stopped transmitting pictures, however as “Steppenwolf” nears winds have picked back up to the 14-18 mph range, and temperatures have risen nearly to freezing. Back at 1200z Conjunct
Buoy 2013F: was reporting -1.98 C, but I suspect the 0000z report will be higher. (
It was -0.42 C.)
SEPTEMBER 1 —DMI Morning Maps—
NEW CAMERAS
Northern camera continues to gaze over a cold (-3.0) and calm landscape. Perhaps it is trying to clear up, as “Owtada” fades away towards the Kara Sea. Cold to the south at
Buoy 2014E , where it was -3.90 C at 0000z and -4.91 C at 1200z.
The southern camera still isn’t transmitting pictures, which is a pity as winds are up near 25 mph, as “Steppenwolf” redevelops. Conjunct
Buoy 2013F: is slightly colder at -0.96 C at 1200z. All nearby mass-balance buoys are below freezing, with the exception of the old veteran
Buoy 2012G: far to the east, which at +0.49 C continues to show the inflow of mild air that refired “Steppenwolf”.
SEPTEMBER 1 —DMI AFTERNOON MAPS—
As “Owtada” is absorbed south through the Kara Sea into “Artless,” and high pressure replaces it over the Pole, we’ll briefly have a trio of storms rotating around the Pole, before things return to chaos. “Steppenwolf” head east through northern Canada towards the top Of Hudson Bay, “Tobal” will get flattened north of Iceland and squirt energy north of Norway, and “Artless will move northeat through the Laptev Sea and be the next storm to charge the Pole, late Friday.
It will be interesting to watch how much mild air these three storms are able to inject north.
NO REPORT FROM CRUNCHED CAMERA
NO NEW PICTURES FROM EITHER SOUTHERN OR NORTHERN CAMERAS.
THE LAPTEV NOTCH —(What I wonder about when cameras don’t work)
Without pictures to ponder, my wandering mind went to Siberia, to think about what ruined my ice-extent forecast. Usually winds blow south over the Laptev Sea in the summer, and ice would be spread out at least as far south as 80 degrees latitude, but that didn’t happen this year:
:

I decided I need to study the Laptev Sea, which is well worth the trip, as it is a fascinating place. To the south its water is quite shallow:
And it is fed by the worlds tenth largest river, the Lena River
:
The Lena flows through a landscape which can be as cold as Antarctica during the winter. For example, Yakutsk in the above map has a record low of -83.9 (-64.4 Celsius.) However, utterly unlike Antarctica, during the summer it can get quite hot, and the record high at Yakutsk is +101.1 (+38.4 Celsius.) That means temperatures can vary 185 degrees between winter and summer. Ponder that. What does that mean, in terms of the Lena River?
| [hide]Climate data for Yakutsk, 1971-2000 |
| Month |
Jan |
Feb |
Mar |
Apr |
May |
Jun |
Jul |
Aug |
Sep |
Oct |
Nov |
Dec |
Year |
| Record high °C (°F) |
−5.8
(21.6) |
−2.2
(28) |
8.3
(46.9) |
21.1
(70) |
31.1
(88) |
35.1
(95.2) |
38.4
(101.1) |
35.4
(95.7) |
27.0
(80.6) |
18.6
(65.5) |
3.1
(37.6) |
−3.9
(25) |
38.4
(101.1) |
| Average high °C (°F) |
−35.1
(−31.2) |
−28.6
(−19.5) |
−12.3
(9.9) |
1.7
(35.1) |
13.2
(55.8) |
22.4
(72.3) |
25.5
(77.9) |
21.5
(70.7) |
11.5
(52.7) |
−3.6
(25.5) |
−23.1
(−9.6) |
−34.3
(−29.7) |
−3.4
(25.9) |
| Daily mean °C (°F) |
−38.6
(−37.5) |
−33.6
(−28.5) |
−20.1
(−4.2) |
−4.8
(23.4) |
7.5
(45.5) |
16.4
(61.5) |
19.5
(67.1) |
15.2
(59.4) |
6.1
(43) |
−7.8
(18) |
−27
(−17) |
−37.6
(−35.7) |
−8.8
(16.2) |
| Average low °C (°F) |
−41.5
(−42.7) |
−38.2
(−36.8) |
−27.4
(−17.3) |
−11.8
(10.8) |
1.0
(33.8) |
9.3
(48.7) |
12.7
(54.9) |
8.9
(48) |
1.2
(34.2) |
−12.2
(10) |
−31
(−24) |
−40.4
(−40.7) |
−14.1
(6.6) |
| Record low °C (°F) |
−63
(−81) |
−64.4
(−83.9) |
−54.9
(−66.8) |
−41
(−42) |
−18.1
(−0.6) |
−5.4
(22.3) |
−1.5
(29.3) |
−7.8
(18) |
−14.2
(6.4) |
−40.9
(−41.6) |
−54.5
(−66.1) |
−59.8
(−75.6) |
−64.4
(−83.9) |
| Precipitation mm (inches) |
9
(0.35) |
8
(0.31) |
7
(0.28) |
8
(0.31) |
20
(0.79) |
35
(1.38) |
38
(1.5) |
37
(1.46) |
31
(1.22) |
18
(0.71) |
16
(0.63) |
10
(0.39) |
237
(9.33) |
| Avg. precipitation days (≥ 1 mm) |
2.1 |
2.0 |
1.9 |
2.9 |
3.8 |
7.3 |
6.5 |
6.0 |
5.3 |
6.1 |
5.7 |
4.1 |
53.7 |
| % humidity |
76 |
76 |
70 |
60 |
54 |
57 |
62 |
67 |
72 |
78 |
78 |
76 |
68.8 |
| Mean monthly sunshine hours |
18.6 |
98.0 |
232.5 |
273.0 |
303.8 |
333.0 |
347.2 |
272.8 |
174.0 |
105.4 |
60.0 |
9.3 |
2,227.6 |
| Source #1: Pogoda.ru.net[18] |
What it means is that the flow of the Lena River is greatly reduced during the winter, for nothing melts to feed the tributaries. At times the river can even freeze to its bottom in shallower places, which would create a dam and a flood, if the the water wasn’t running so slowly to begin with. Only 3% if the yearly flow occurs in January, and February and March aren’t much different.
During this time the Laptev Sea produces and exports a lot of ice. It exports due to its own private gyre, formed by a current that comes down from the north on its west side, then east along the coast, and then north up its east side. Also there is a fairly constant land breeze, all winter, because the air inland is so much colder than the air out to sea. The export of ice can vary a lot; (Wikipedia states: “the annual outflow fluctuated between 251,000 km2 in 1984–85 and 732,000 km2 in 1988–89.”) and we don’t have records for the onset of a “cold” AMO, but the export is often great enough to produce open water, or a “polynya” (Wikipedea says these are formed by “warm” southern winds, but in January the winds can leave the coastline at minus-seventy.) Here is a picture of ” Great Siberian Polynya” from outer space. It is to the left of the picture. The New Siberian Islands, which separate the Laptev Sea from the East Siberian Sea, are at the center.

As the ice forms prior to export it exudes salt, so the water gets saltier during the winter, but then things change.
Although it is fairly arid upstream, the snow that does fall can never melt. Some does sublimate, but much is left behind. If five inches of water fall during the dry winter, that translates to 50 inches of snow, and even if half of it sublimates, you are still left with two feet sitting around, and then the days get very long and the temperatures soar and it all melts at once. The floods on the Lena River are legendary. The water can rise sixty feet. (Think a six story tall building.) As much as 40% of the yearly run-off can occur in August.
That is a huge surge of fresh water, warmed by passage through a summer landscape, pouring into the eastern Laptev Sea. Because it is warm, and also because it is less salty, it forms a “lens” on top of the colder water, (which sometimes is Atlantic water, and also is warmer than the water it sits upon.)
Personally I have doubts about how much Atlantic water penetrates this far east along the Siberian coast. I think it must vary greatly, depending on how open and how stormy the waters of the Barents and Kara Seas are. I think very few measurements exist from the last time the AMO was shifting from “warm” to “cold” So there is plenty of room for theory.
When Atlantic water does slide in you have a cake of three layers. Deep arctic water around minus one, Atlantic water that is saltier but make buoyant by warmth at around plus one, and then a top layer of river water made buoyant by both freshness and heat. A month from now it will have lost the heat-buoyancy, and only be bouyant due to freshness. As it moves north it mixes with salt water and at some point becomes less buoyant than the layer beneath, and then it sinks. To the south it is so fresh it can freeze before ocean water ordinarily would freeze.
Hmm. See what I mean? A lot to ponder about.
SEPTEMEBER 2 —DMI Morning Maps—
Don’t have time to comment. Notice high pressure building over the Pole. Temperatures are warmer than normal.
LAST YEAR COMPARED TO THIS YEAR
Bill Illis posted these two pictures as a comment over at What’s Up With That. I think they do a good job showing how the ice didn’t “spread out” this year, which is my best excuse for utterly blowing the ice-extent-minimum forecast.
The ice pack is far more solid in 2014 than last year’s “recovery” ice.
2014.

versus 2013.

NEW CAMERAS ARE TRANSMITTING PICTURES AGAIN
SEPTEMBER 2 —DMI AFTERNOON MAPS—
NEW CAMERAS —The gathering gloom—
As this post is threatening to melt down my computer, as it has gotten too long, I will start a new post, to be found at: https://sunriseswansong.wordpress.com/2014/09/03/arctic-sea-ice-melt-the-minimum/


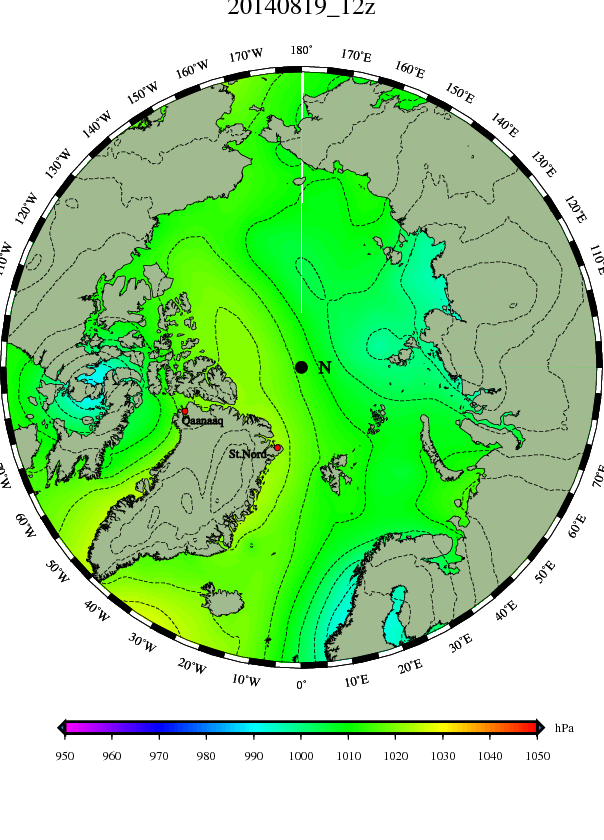


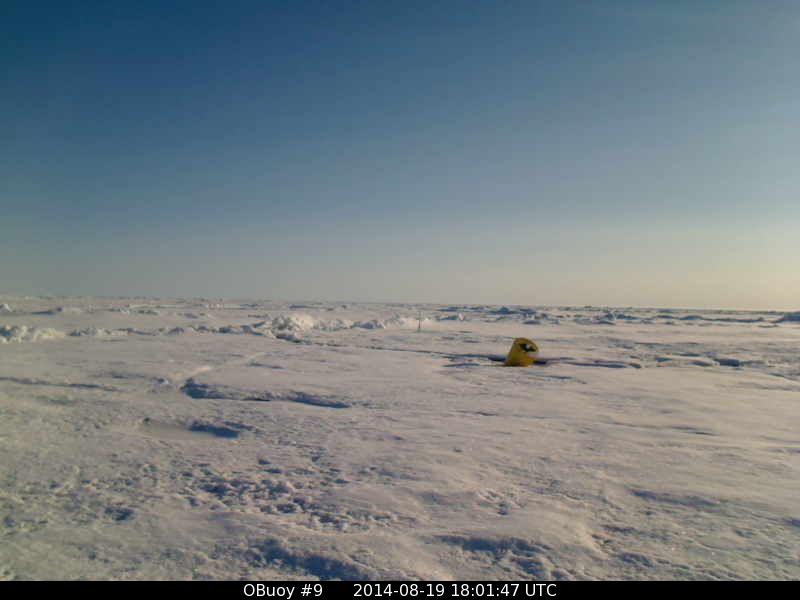


 (click to enlarge)
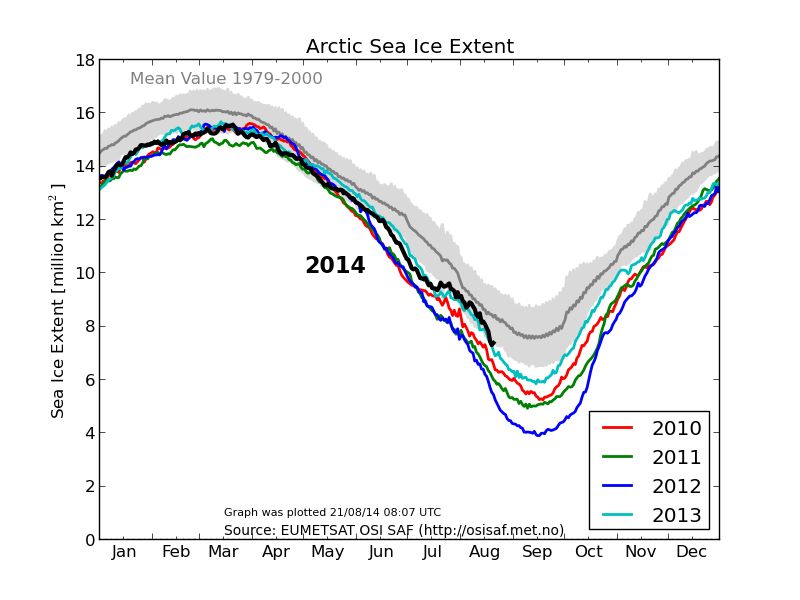 (click to enlarge)


 (Click to enlarge)
 (Click to enlarge)


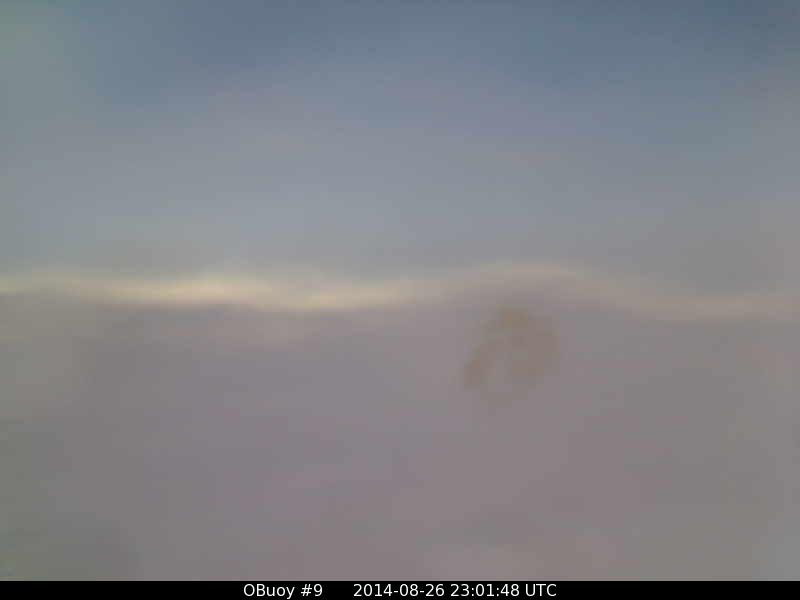

 (Click to enlarge)


 (click to enlarge)


