I have been urged to put aside my novel for a day, and comment on the sea-ice maximum. I only do so out of fondness for old friends, for I have personally become more interested in what I discovered while studying sea-ice than the sea-ice itself.
What I discovered was that both the science involved in the so-called “Arctic Death Spiral”, and the media’s efforts involved in reporting the “Arctic Death Spiral”, were shoddy at best and highly suspect at worst. Truth did not seem to matter as much as selling a particular political view, and, because I feel that any political view that disregards Truth is doomed to disaster, this behavior seemed like that of lemmings rushing towards a cliff.
Therefore my mind is more interested in contemplating the apparent madness of my generation, than it is in studying sea-ice. My novel looks back to when my generation was just stepping out into the world, and it contemplates how my generation’s sweet and naive hope for “Peace, Truth and Understanding” could, in some cases, be amazingly corrupted.
However I still do watch the sea-ice, as it ignores all politics and reflects the Truth of the Creator, and its motions can rest the mind with the same sort of serenity one derives from laying on ones back and watching clouds.
I’ll pick up from where I last left off reporting after Christmas, with the post: https://sunriseswansong.wordpress.com/2014/12/28/arctic-sea-ice-recovery-sneak-attack-onto-europe/
At that point a surge of mild air up towards the pole ahead of several North Atlantic Gales had relapsed or sagged back south in the north flow behind the gales, as the storm track of those gales slumped down into western Siberia. The flood of cold air built an elongated east-west ridge of high pressure over Europe. To the south of the ridge cold winds from Siberia flowed west, and there was snow even on the north coast of Africa. But our polar-view maps see only the milder west winds bringing Atlantic air east over the top of the elongated high. This mild air is clashing with cold air over the Pole, and brewing a storm over Svalbard. Across the Pole Pacific air has been pulled through the Bering strait and generated a nifty storm north of Alaska.
This was one of the few times all winter the Pole’s temperatures were below normal, but the pool of cold was being eroded from both sides. .


By Dec 31 the gale over Svalbard had grown, while the Pacific storm faded south and strong high pressure built. Mild air was dawn up into Barents Sea, as cold air flowed south through Fram Strait down the east coast of Greenland. More cold air is being exported south to Hudson Bay. Less usual is the reverse cross-polar-flow, from Alaska back to Siberia, north of Bering Strait.


By January 2 that reverse-flow has vanished, replaced by Pacific air pouring north through Bering Strait as Atlantic air pours north over Svalbard. These influxes warm the Arctic Sea’s surface temperatures, but only south of Bering Strait and south of Svalbard is the warmth enough to melt sea-ice.
I think these influxes represent cooling, for the planet as a whole, for this is occurring during the darkest days, and much heat is lost to outer space. The sea-ice may be split and tortured by the shifting winds, but it is largely pushed towards the Pole, and compressing. Less than normal amounts are being flushed south through Fram Strait, as is shown by less ice moving down the east coast of Greenland, but that flow has increased at this point, as the North Atlantic gale is in a sort of “normal” position, bringing gales down Greenland’s east coast..


By January 3 the amount of very cold air over the Pole has decreased, due to the Pacific and Atlantic invasions. This is an indication we are not seeing a “Zonal” flow, where winds go around and around the Pole, and the cold is contained up there. The invations of warming-than-usual air we are seeing up towards the Pole are matched by exports that cause arctic outbreaks further south.
In terms of sea-ice, there is a great deal of movement. The ice is split apart, forming “leads” which swiftly freeze over (but lose a lot of oceanic heat in doing so) and then are slammed together again, forming “pressure ridges” which are like mini-mountain ranges of sea-ice, ranging from only knee high to over fifteen feet. Not only do they extend upwards, but have roots extending downwards (because 9/10th of an iceberg is under water.)
During the summer stormy conditions can reduce sea-ice, especially if the water is stratified and a layer of warmer water lies below. During the winter stormy conditions likely increase sea-ice by exposing more water to temperatures well below the freezing point of salt water. Also the wider leads allow water to be to some degree churned, which prevents stratification, and allows the water to be more efficiently chilled.
The invasions of oceanic air likely increase snowfall, which actually may decrease the amount of sea-ice by insulating the ice, and by slowing the growth of ice on the underside of flat areas of ice. On the other hand, as soon as the sun rises at the Pole on the spring solstice, that same snow-cover protects the sea-ice, by reflecting the sun’s rays.


On January 5 the invasions of oceanic mildness had generated a genuine arctic gale. These storms stress the sea-ice a lot. I’ve also noticed that, while they represent updrafts of mild air, they are often followed by increasing cold. They may lose a lot of heat, but how this might be done generates a lot of debate.


By January 7 the gale has faded down towards the Kara Sea, but high pressure is bulging north from Alaska, and the pressure gradient between that high and the weakening gale is quite strong, and pulling Siberian air across to Canada.
When a strong flow like this gets going the cold air screams off the Siberian coast with such power that the ice is pushed away from the shores of the Laptev sea. There can be open water when the Siberian winds are down near seventy below. Of course this open water freezes swiftly, but even as a new skim of ice forms it too is pushed out to sea. During these situations the Laptev Sea creates and exports amazing amounts of ice. This winter this ice-creation also occurred along the coast of the Kara Sea.
This process of ice-creation actually can make it look like there is less ice, on the “ice extent graph.” The graph shows less ice along the Siberian coast, as the ice has been pushed towards Canada. The thinner ice along the Siberian coast is easier to melt away in August. However what is difficult to measure, in terms of “extent”, is all the ice crushed up against Canada by the Transpolar Drift.
A very strong gale off southeast Greenland is creating a wrong-way flow up in Fram Strait, halting the export of sea-ice.


By January 10 the cross-polar-flow is being interrupted by new invasions of Pacific and Atlantic air. The wrong-way flow in Fram Strait is weaker, but continues, and there are even weak impulses of low pressure heading that way, rather than taking the more normal route between Svalbard and Norway.


By January 12 a final, weak wrong-way low has moved to the northwest of Greenland, as a more conventional gale is moving up between Iceland and Norway.
What is interesting to note is what has become of all the oceanic air imported to the Pole. It has chilled down. This is the fate of all air, in 24-hour darkness.
Also the Siberia-to-Canada cross-polar flow has reappeared.


By January 14 the Atlantic Gale is weakening, and the cold keeps building over the Pole.
What is interesting about these gales is how different they are from last winter’s. Last winter’s tended to stall further south, and I said they should be dubbed “Britannic Lows” rather than “Icelandic Lows.” Because they were positioned further south they tapped into the Azores High and brought up mild southwest winds, giving even Finland a milder winter. This winter it is as if the Azores High is walled off. Instead the big gales tap air from either side of Greenland and from Labrador, and even after crossing thousands of miles of water warmed by the Gulf Stream they make a far colder southwest wind, when they get to Europe.
The cross-polar-flow is starting to break down. Watch how it collapses towards Iceland.


By January 16 the old gale has drifted off to the Kara Sea and weakened, and has been replaced by a new gale, as the cross-polar-flow has swung down to Iceland. Watch how that flow continues to collapse down towards England. (This is a lot like what happened around Christmas.)


By January 17 the flow is down the coast of Norway towards England, and the new gale is weakening and sagging south. In essence, the storm track has swung clear across the Atlantic, from aiming the wrong way up Fram Strait over Greenland to crashing into Europe. As this dramatic sway has occurred, the Pole has been left alone, and cooled to normal.


At this point something else dramatic was occurring that doesn’t show on the maps. It was of great interest to me, because I wondered if it might occur over a year ago. (I’m not sure where I wrote the thoughts down; it may have been while chatting with someone in the comments section.)
Last winter, when the Atlantic Gales stalled-out so far south and east that I dubbed them the “Britannic Low”, it may have brought benign mildness to the east of the centers, but to the west north winds rushed south over Iceland and vast stretches of the Atlantic, including the Gulf Stream. It may have seemed like the arctic air was spent harmlessly over waters where no one resides, but I wondered what effect all that cold air, which rushed south week after week even as Europe enjoyed week after week of low-heating-bills, might have upon the sea water’s temperatures. It seemed the north winds must chill the Atlantic waters, and do so to considerable depth, because some of the gales were enormous and the seas must have been gigantic, and stirred the waters deeply.
Although the water was cooled thousands of miles from Europe’s coast, all that water is on the move. True, it moves less than a mile per hour, but a layman like me can do a back-of-an-envelope calculation, and I figured the cold water would arrive off Europe in around a year. There was nothing very scientific about my calculations. It was more of a wondering than any sort of theory.
Then, around a year later, the sea-surface temperatures cooled surprisingly swiftly towards Europe , compared to normal. You can bet my eyebrows mooned, when I noticed this. It effected the calculations used to determine the AMO (Atlantic Decadal Oscillation). Although that oscillation was not expected to switch over to its “Cold” phase for several more years, this January saw it plunge to levels on the “Cold” side not seen in decades.
All bets are off. This is a big shift, and the last time it happened was before we had satellites. We are entering Terra Incognito.
Not that the maps got all that dramatic. January 19 showed things seeming to swing back to another wrong-way flow up through Fram Strait, and, even as cold east winds afflicted areas of Europe and the Mideast south of these maps, new invasions of milder air were gathering to attack the Pole from both the Atlantic and Pacific side.


January 21 shows the invasive process continuing. The cross-polar-flow is less obvious, for rather than a stream of isobars it is shown by blobs of cold high pressure moving from Siberia to Canada.


At this point large gaps appear in my notes. I apologize, but we were getting clobbered by blizzards in New Hampshire. Survival, at least in a business sense, focused on snow-removal, and if I was going to stagger indoors and record anything for posterity, recording how a New Hampshire town battled a severe winter seemed more newsworthy than arctic sea-ice far away. However I did note a few things.
On January 26 another big Gale was crossing the Atlantic, as a very cold high pressure sat atop the Pole. Between the two they created a strong wrong-way flow through Fram Strait.


On February 1 the gale is cetered south of the Baltic and the high pressure has shifted towards Svalbard, Franz Joseph Land and Barents Sea, but the flow is still the wrong way through Fram Strait.
This stuff matters, if you are accounting for sea-ice. The ice that doesn’t come down through Fram Strait does two things. One, it makes the “ice extent” graph look lower, because there is less ice drifting down the east coast of Greenland. Second, because that ice only heads south to be melted, it means there is more ice left behind up in the arctic, which may mean the “ice extent” graph will show more ice in the summer, many months away.
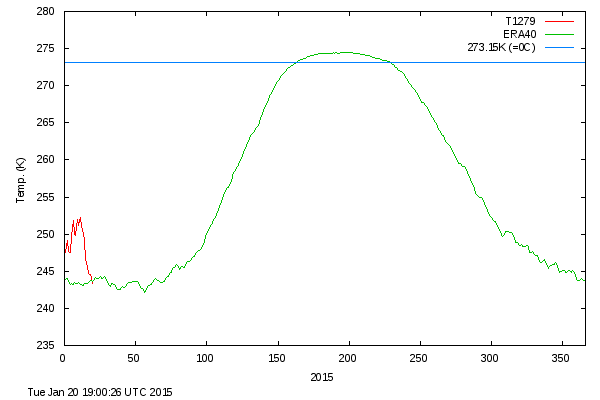
For only the third time all winter, temperatures neared normal in the arctic.


By February 3 the wrong-way flow was bringing mild air up west of Svalbard to nudge against very cold air, which always seems a recepie for storm to me, but I didn’t expect the storm that developed.


February 6 shows the Noodle Storm, pulling very mild air right past the pole, driving a cross-polar-flow from Siberia to Canada, and also a “correct” flow, for a change, down through Fram Strait, and then down to Scandinavia.
It would have been fun to study this in greater depth, but at this point winter was using the people of New England as a punching bag.


By February 8 the Noodle Storm was sagging south into Europe, and the cross-polar-flow was pronounced, and winds were dropping to a calm in Fram Strait. The Pole is doing a good job of cooling all the mild air brought north.


(There is quite a gap here, as I figured I didn’t have enough to do, and should also write a novel.) The February 15 map shows what I think is left of the Noodle Storm has drifted to central Siberia, bringing its milder air with it. Cross-polar-flow continues, now bringing arctic highs across Bering Strait. A powerful gale is hitting Iceland, but will you look up in Fram Strait? Everything is going the wrong way again.


By February 18 the gale has passed well north of Scandinavia, and the flow is the right way in Fram Strait. Mild air is pouring towards the Pole from both the Atlantic and Pacific sides, but blobs of cold high pressure continue to march from Siberia to Canada.


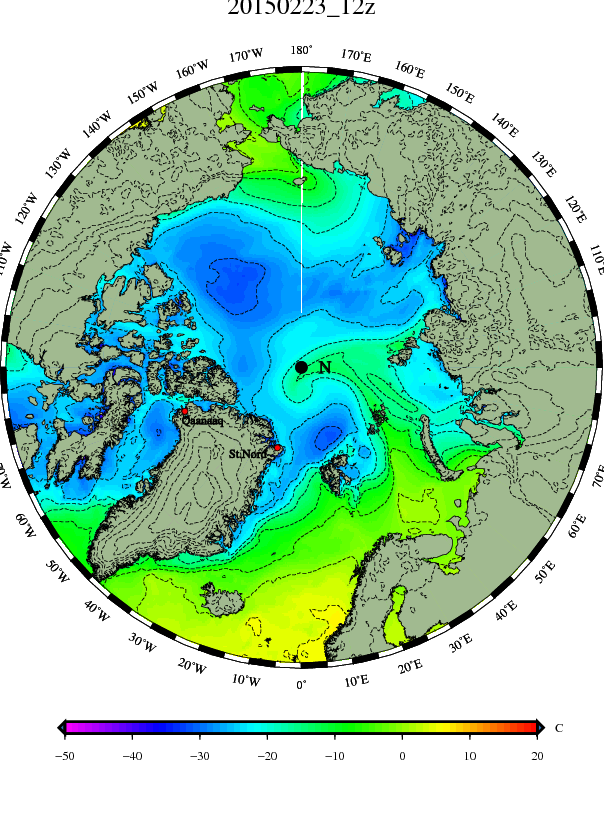
On February 23 a micro-gale caught my eye, as it approached the Pole. Not that I had time to study it, though they are an interesting Polar phenomenon, and may be like hurricanes. As you can see, I couldn’t get my act together enough to save a temperature map.

I did remember to get a temperature map twelve hours later. I didn’t like the looks of that blob of Siberian high pressure being squeezed across to Canada. I likely should have paid more attention to the powerful gale southeast of Iceland. However mostly I wondered what the mirco gale was doing to the sea-ice at the Pole. The isobars are packed and the winds must have been strong.


Twelve hours later I forgot the surface-pressure map, and only got the temperature map. (By this point most of the population of New England was approaching delirium, as snow depths passed six feet in places.) It does show how that mirco low sucked milder air right up over the Pole. It also shows mild air coming through Bering Strait from the Pacific, and the cold cross-polar-flow bringing more air from Siberia to Canada, and then down to New England. This was starting to annoy me. I mean, enough is enough.

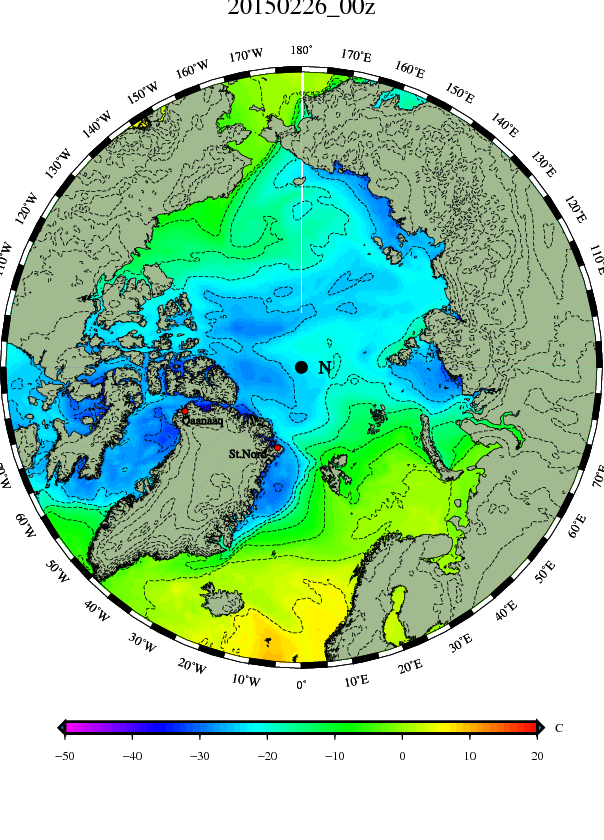
By February 26 the first Gale has weakened, taking the route north of Norway, as the mild Pacific air has generated a storm of its own. Between the two the cross-polar-flow looks to be weakening. A powerful gale approaches Iceland from the west.


Four days later it looks like the Pole has stopped exporting cold, and is gathering its resources. A final glob of cold is passing into Alaska, but sucking Pacific air north in its wake. North Atlantic low pressures extend all the way to central Siberia, and have pulled some milder air up the entire eastern side of the North Atlantic.


On March 3 the Pacific invasion has started again, and the Atlantic invasion continues despite the swiftly weakening low and the building high pressure north of the Kara Sea.


By March 6 the Atlantic surge has become impressive as the Pacific surge retreated. Once again cross-polar-flow is developing.


March 9 shows the Atlantic invasion at its high point (I think.) A sprawling gale is over Svalbard, wheeling mild air up over the Pole itself. However it is still dark over the Pole for another eleven days, and that mild air can only chill.
A meandering cross-polar-flow persists.


The invasion of Atlantic air spikes the arctic temperatures.

And now, at long last, we look at the ice extent graph:

Hopefully by subjecting you to all these maps I’ve shown that edge of the sea-ice has been eroded north a lot this winter by influxes of Pacific and Atlantic air. Also, because the bitter Siberian air headed across the Pole towards Canada, there was less bitter cold air left behind to create sea-ice off the Pacific coast north of Japan, (where there is much less ice than normal.) However the fact remains: There is less ice at the maximum.
The question immediately asked is: Does the lowness of this graph indicate the world is warming?
No. It means the cold air was distributed differently this winter. If the flow was “zonal”, the cold air generated by sunless winter days in the arctic would have stayed up north, and frozen northern waters. However the flow was radically “meridinal”, which means the cold headed south. As a consequence warm air has repetitively flooded up into the arctic, on both the Atlantic and Pacific sides, and frayed the outer edges of the sea ice, on those sides. Meanwhile there was significantly more ice on waters that are not used in the calculations for the sea ice extent graph. For example, take the Great Lakes:

Or take the saltwater bays off the east coast of the USA.

The freezing of these waters, which ordinarily are not ice-covered to such an extent, could be used to argue the world is in fact colder, if one wanted to go that route.
The exact same “albedo” equations used up at the Pole can be used on the Great Lakes and the East Coast of the USA, and could demonstrate a huge amount of sunlight is being reflected back into space. After all, there is no sunshine at all at the Pole right now, but the sun is high in the sky further south. By the time the southern ice is melted it will have reflected a sizable amount of heat, but don’t ask me to fool around with the numbers. It would take a lot of “absorbing” for northern ice-free waters to counter that “reflected” deficit.
And that doesn’t even consider the surplus ice in the waters around the South Pole. It doesn’t take a lot of brains to compare the areas of ice, and the latitudes the ice is at, and determine the “albedo” arguments simply don’t add up.
In order for the “albedo” argument to work, there must be less solar radiation reflected and more absorbed, resulting in increasing temperatures. The problem is, the idea doesn’t work even if you utterly ignore the Great Lakes and the East Coast of the USA and the Antarctic. In order for it to work, the ice must decrease at the North Pole.
Even after a winter like this, where the arctic was robbed of a lot of its cold, there are some signs that the ice is increasing. Less ice seemed to be flushed south through Fram Strait, and more ice seemed to be packed together at the Pole. However in order to see these signs you have to do your homework, and become acquainted with individual chunks of ice.
For example, consider the buoy 2012G, which is tracked by the purple line in the map below.

For over three years I’ve watched this buoy as it has wandered the Arctic Ocean, part of a mass of ice that has more than doubled its thickness, from less than six feet to more than twelve. Watching it does not give one the sense ice is getting thinner and weaker.
Another buoy, “Obuoy 9”, past roughly the same area by the Pole two years later, but took a radically different course, and is now north of the Greenland coast. ( See map at http://obuoy.datatransport.org/monitor#overview/gpstracks )
If you do your homework and follow such buoys, (many of which have anemometers, thermometers, barometers, and cameras attached), you swiftly learn how mobile the sea-ice is. One buoy I followed began close to the Pole in April and grounded on the north coast of Iceland 8 months later. Most of the ice on the Arctic Sea has a life expectancy of less than two years, and the ice at the edges seldom lasts longer than a few months.
More than half of the ice melts every year, and one year it was three quarters. Then it grows back. You can write both the screaming headline “67% Of Arctic Sea-Ice Melts!” and the headline “Arctic Sea-Ice Triples!” on the same year, and not be a liar.
Considering these amounts are so huge, it is a bit ridiculous to obsess about small seasonal variations in the maximum and minimum extent. They have nothing to do with either a coming “Ice Age” or a coming “Death Spiral”. They have everything to do with the planet’s futile but constant effort to achieve balance, when it it is constantly knocked out of balance by sunspot cycles, and also the simple fact Earth is tilted, and we have seasons.
As the planet attempts to arrive at equipoise it manifests various actions and reactions, and the PDO and AMO are such actions and reactions. Those who want to understand why the ice comes and goes the way it does would do well to study those cycles, and what causes them.
Two major things are likely to influence the melting and reformation of sea-ice over the next few years. The first is the switch of the AMO to its “cold” phase this past January:

The second is that the sunspot cycle is reduced, and we are seeing a “Quiet Sun.”

My private wondering is about how the “Quiet Sun” may alter the PDO and AMO. They may not behave as we’d expect them to, if they were following a stable 60-year-cycle, because the sun was far from “quiet” 60 years ago.
However if things behave as they behaved in the past, I would expect the shift of the AMO to “Cold” to result in a swift increase of sea-ice on the Atlantic side, over the next year. There is no sign of this yet.
THINGS TO WATCH FOR
As more than half the ice melts away this summer one can measure whether the melt is above-normal or below-normal by visiting a Cryosphere Today page that graphs the melt of all the various Seas, and whether the melt is above or below normal. For example, Hudson Bay can be viewed here: http://arctic.atmos.uiuc.edu/cryosphere/IMAGES/recent365.anom.region.13.html
If you scroll down to the bottom of the Hudson Bay screen you can see a handy map that allows you to swiftly click to the graphs for other areas.
I chose Hudson Bay because it will be interesting to watch. Usually it is entirely ice-covered by now and entirely ice-free by August, however on rare years not all the ice melts away. Last year the ice barely melted away, but the water was quite cold to begin the winter, and froze swiftly. Now the ice is thick and has piled up deeply against the south and east coasts. The refreeze of Hudson Bay means a lot for the east of the USA, for until it freezes its open water moderates the temperatures of arctic air coming south, and it serves as a buffer. It would not bode well for the northeast coast of the USA if a winter began with ice already in Hudson Bay.
Another place to watch will be Barents Sea north of Scandinavia. Last year, with the AMO only briefly dipping to the “cold” side, the ice actually increased in Barents Sea even as it retreated everywhere else. I am not sure how this is even possible, with the temperatures rising all over the arctic to above the freezing point of salt water. It must be that the ice that already exists drifts south. In any case, it may happen again. If it does happen, it may explain the surprising increases of ice hinted at, in that area, by old, Danish maps showing where the edge of the ice was as the AMO turned “cold”, back in the days before we had Satellites to watch with.
Happy ice-watching!