
(Please note that this post is dated October 25, 2014. I have had a number of hits on this old post today, October 19, 2015, nearly a year later, and fear people may be taking last year’s information as being up-to-date and current. That being said, it is indeed interesting to compare the two years.)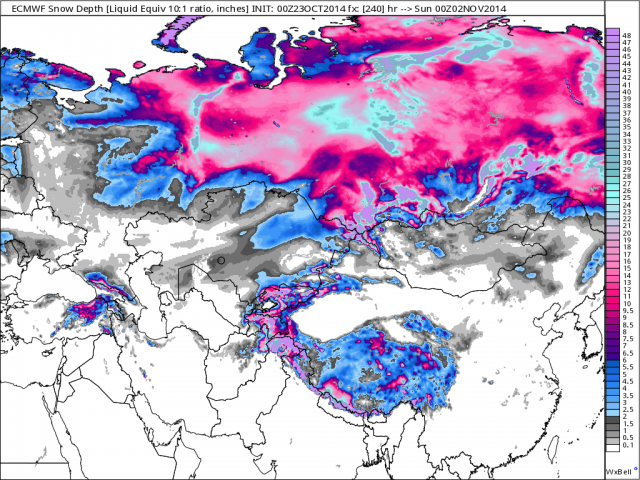
(CLICK MAP TO CLARIFY AND ENLARGE) The above map jumped out at me as I prowled the web for news. I found it among the heaps of information Joseph D’Aleo provides at his blog at Weatherbell, and is one of the thousands of maps Dr. Ryan Maue provides at that site. It shows the snow-cover in Siberia building to cover most of Russia by November 2. (Please note this article was written in 2014, though it in some ways also applies to this autumn’s situation [2015]). This year the early snow seems centered more towards western Russia. Check the top of my website for the latest post on Europe.)
This is a lot of snow for this early in the winter, and does not bode well for all northern lands. Snow-cover allows Siberia to lose heat through radiational cooling, and the area “produces” cold, pressing down as high pressure which then then moves outwards in all directions. The earlier the snow-pack forms, the earlier pools of extreme cold can be created. Already temperatures in east Siberia are touching that magic number of minus forty, where both Fahrenheit and Celsius agree. (The Maue-made temperature-map below is in Fahrenheit.)
 (click to enlarge)
Freezing temperatures (below 32 Fahrenheit) are shown where sky blue turns to pink, and extend from Finland to Manchuria. Where Fahrenheit temperatures change from above zero to below zero (-18 Celsius) are shown by the deep blue areas within the pink turning to gray. When the gray blackens and then turns back to sky blue again, in the very center of the cold, we are seeing temperatures of minus forty.
These areas will enlarge as winter comes on, for Siberia experiences the coldest temperatures seen in the northern hemisphere, and can get down to minus seventy. The Arctic Ocean cannot get so cold, due to the warmer water under the ice, and only gets down to minus fifty on rare occasions due to Siberian air pouring north (and more rarely Canadian cold pouring north.)
This early in the dark days there is still open water along the Siberian coasts, and the temperature contrast is huge. The unfrozen water heats the air to plus thirty as the air over the land is minus thirty, and this sixty degree difference results in a Land-Breeze, with cold air sinking and rushing out over the sea, as the air over the sea rises. This swiftly freezes the sea, but also pushes the new ice north towards the Arctic basin, especially in the Laptev Sea.
The cold air also pushes east over the Pacific, cooling its waters, and south into China and west into Europe, cooling lakes that, until they freeze over, remember the summer’s warmth and act like small radiators. Once they freeze over, and once the Siberian coastline freezes over, the cold becomes more able to expand. To have this process well underway in October is not a good sign.
You can see the warming effect of the sea on the Pacific coast, and north of Scandinavia, and to a lesser degree over the Laptev Sea. This effect will diminish as the ice builds. Ice seldom forms north of Scandinavia, due to tendrils of the Gulf stream, but the freeze-up of the Pacific coast is amazing, and extends out for miles. The arctic coast freezes up early, but the winds off Siberia can be so strong that ice is pushed away from land, and slightly warmer water up-wells as surface water is pushed north, and polynyas if open water can form even when temperatures are fifty below, especially in the Laptev Sea.
What I watch for is a cross-polar-flow, which brings the Siberian air to Canada and Alaska. Though this air is warmed to some degree as it crosses the relatively mild ice on the Arctic Sea, the warming can be a thin layer at the surface, with the bulk of air entering North America as a frowning Siberian high. This then gets even colder over the American tundra, especially as the northern Canadian Great Lakes, (Greater Slave, Lesser Slave, Bear, and Winnipeg) freeze over in October, and even more when Hudson Bay freezes over later in October into November. The earlier the lakes and bays freeze the earlier nasty cold can build, and come howling south, and clash with moist air coming up from the Gulf of Mexico, and breed our blizzards.
What you want to see, if you want a mild winter, is a shallow Siberian snow pack that forms late. You don’t want to see over a foot of snow covering large areas of Siberia when it is still October.
When I was young I’d be clicking my heels and anticipating snowstorms cancelling school, but those days are long gone.
UPDATE—OCTOBER 29
Over on his excellent blog at Weatherbell, Joe Bastardi today noted that we are now up among the top three on terms of world-wide snow-cover, at this date, early in the season. Not only is most of Russia covered, but a lot of Canada and Alaska as well.
Then he did something I lack the time to do, which was to check the history. It is important to see what the “precedent” is, before you use the word “unprecedented.” It is also helpful to know what to expect. What Joe found surprised me, for he found some winters that started out like gang-busters, in terms of world-wide snowfall, and then backed off and became unimpressive winters. He also found winters that began with little snowfall that were late starters, and became severe later.
This throws a monkey wrench into the works of my idea that snowfall is a feedback, and that a lot of snow creates an Asian high pressure of sinking, cold air that creates more ice and snow, and therefore more cold, in a sort of vicious cycle.
Unfortunately I don’t have the maps of the winters that disprove my theory, and therefore can’t study what the heck went on. When I’m rich I’ll hire some eager, young go-for to look all that stuff up for me.
However Joe also mentioned that one of the top three years, in terms of snowfall on October world-wide on October 29, was 1976. There’s that year again. The winter of 1976-1977 was the worst, in terms of cold, and in terms of sea-ice along the east coast of the USA, that I can remember. So…we definitely shouldn’t lower our guard.
UPDATE #2 —NOVEMBER 2, 2014—
Here is a map of the actual November 1 snow-cover, to compare with the forecasted map I posted above.

Siberia exported its first batch of very cold air largely to the east, out over the northern Pacific ocean. Those waters, which were largely at above-normal temperatures during the summer, have been cooled and now are below-normal towards the Pacific coast of Asia.
A new batch of very cold air is pooling over Siberia:
 Watch to see where this batch of cold air goes. If it heads east again it will be starting to resemble the flow in 1976-1977, which often came across the Bering Strait and down into Canada and eventually the USA. Ar the moment the water in the Bering Strait and East Siberian Sea is open, (likely due to a “warm” spike in the predominately “cold” phase of the PDO), and the Siberian air is being warmed by that water on its way to North America. Once those waters freeze, look out!

The ice formation is advancing rapidly in the Kara Sea
I’ll go take a look at those maps.
Wow! You weren’t kidding! Check out the 30-day-animation at the Navy site here: (The last 5 days are a forecast.)
The Laptev Sea is going to flash-freeze, it seems.
I just checked out the the computer models. It looks like a couple of big North Atlantic gales could bring a big surge of south winds up through Scandinavia, and then move through the Kara Sea. That ought slow the formation of ice there for a few days.
Hello, where are the snow depth images available from please?
Also I have just discovered your website today, it is very interesting. I love Siberia and am always interested in the weather conditions there. Keep up the good work!
Thanks for the kind words.
I got the snow-depth from Joseph D;Aleo’s blog at the Weatherbell site. It is from the European model, called the ECWMF.
There is a genius at that site called Dr. Ryan Maue who gathers the data from the computer models and creates incredible maps. I think there is some sort of one week trial you can get for free. (I pay roughly the price of a cup of coffee a day.)
There are literally thousands of maps you can look at, from the initial runs of the models to what they are saying weeks in the future, about pressures, winds, temperatures, and stuff I don’t even know about.
What you need to look for is the 2 meter frozen precipitation maps. They show how much snow will fall during a given period. I don’t think they say how much will melt away.
There are so many maps that it takes time to find the map you are looking for, until you get used to navigating. However it is great fun.
Thanks for the reply. I can’t afford that website, so I’ll just read your blog. Hopefully you will post some snow depth maps of Siberia in the future 🙂
Probably you’re aware of this site, but
http://earth.nullschool.net/#current/wind/surface/level/overlay=misery_index/orthographic=101.33,37.04,441
is very interesting, especially when you click on the misery index overlay.
Have a nice weekend.