
This is the continuation of a long series of posts, the last of which can be found at: https://sunriseswansong.wordpress.com/2014/06/18/arctic-sea-ice-melt-the-thaw-begins/
I began this series over a year ago, mostly to share a way of relaxing on hot summer days, but also to demonstrate to young reporters how to investigate the arctic, and be less like parrots. I’d been enjoying the North Pole Camera for years, and knew some things reported by the media displayed gross ignorance. Somewhat naively I assumed the media could be educated, and was misreporting due to mistakes, and not as a matter of policy.
Last July a melt-water pool developed right in front of the camera. I correctly said it would soon drain away down through a weakness in the ice, but the media made quite a fuss about the shallow pool being a visual image of Global Warming. No sooner did they draw the public’s eyes north when the water drained away and, a couple days later, the scene was blanketed in snow.
https://sunriseswansong.wordpress.com/2013/07/28/lake-north-pole-vanishes/
During this episode my site went from getting perhaps ten hits a day to getting over five hundred. I decided to contiue this series of observations, as a sort of messy notebook full of ideas, some which have been falsified, and also doodles and even doggerel, as that is how my notebooks have always been. My more polished articles appear as separate posts, and a few have appeared over on the Watt’s Up With That website.
Gradually, over the past year, I’ve become alarmed. Rather than alarmed about Global Warming, I’ve become alarmed at the government’s bad habit of putting “spin” on facts to promote policy. At some point the facts stop being facts, and become distortions. This occurs not only concerning the topic of Global Warming, but with other facts such as Unemployment Figures.
For me to take on the government is a bit like a flea taking on an elephant. I doubt I can slam it down, or topple it. However a flea can annoy an elephant, especially if there are a lot of them, and perhaps can even cause an elephant to go take a bath.
I’m calling this post “Crunch Time” because over the next 30 days we will see if the ice melts as is usual, or if something astounding occurs. What is astounding is forecast by these two government graphs, (which apparently did not get the memo.)
 (Double click to fully enlarge)
The top graph shows the ice-extent going from ,6 million km2 below normal to .6 million km2 above normal during the month of July. This increase is not due to ice growing, but rather due to far less ice melting than usual, as is shown by the lower graph.
In order for this to happen the other extent graphs will have to stop their ordinary and natural yearly plunge, and practically flat-line sideways. Currently there is little sign of this occurring:
 (click to enlarge)
I don’t think the graph will flat-line to the degree the upper graphs predict. It predicts a minimum of 6.8 million km2, while models such as the UK Met predict between 4 and 5 million (which is still a far cry from the “ice free” Pole predicted ten years ago.) I myself predict 6.1 million, which puts me out on a limb.
I base my prediction on observations more like dead reckoning than careful science. The water in the Arctic Sea, and entering the Arctic Sea from the Atlantic, seems colder, and mixed rather than stratified. Also the ice north of Greenland, Canada, and even Alaska is thicker. The pictures sent back by arctic adventurers last April (see earlier posts) were of pressure ridges that dwarfed a man. When these big jumbles fall apart during the summer thaw they have the ability to spread like a pat of butter over toast, and even though the volume of ice shrinks, as it always does in the summer, the extent and even area can blip upwards. Lastly, the air temperatures have been below normal:
 (Click to enlarge)
I don’t think the air temperature matters all that much, as most melting comes from the water below, however these cooler air temperatures may be hinting that the water is in fact colder, as the air temperatures over ocean are greatly influenced by the water.
Lastly I should mention that there are two ways of measuring how much ice there is, and I think we are still in the mode that sees melt-water and slush as open water. This mode is useful in colder weather, and we may be in that mode due to the interest in the ice cover in the colder environment of Antarctica. Usually they switch over to a second mode, which doesn’t see melt-water as open ocean. I don’t fully understand why we haven’t made the switch, or even if this news is accurate, but I felt I should mention it.
In any case, we are now at the point where we will see if the extent fails to drop as much in past years, and, if it doesn’t, it will be crunch time for the politicians. They have based policy on dire predictions, such as the prediction of an ice-free Pole, and when these forecasts prove false, logic would dictate that they change their policy. Can they? Or are they so in love with the unnecessary taxes they hope to get from Global Warming that they can’t change. If they don’t change, they will face being changed, next election. It is not a comfortable pair of slippers to be wearing.
I try to post twice a day, including the DMI maps of pressure and temperature at the Pole. (You’ll have to forgive me for naming storms, and sometimes even high pressure areas, and occationally even features on the isotherm map.) I also include daily pictures from the North Pole Camera. I update at the bottom of this post, which makes these posts get longer and longer. Here are the last updates of the prior post:
JUNE 30 —DMI AFTERNOON MAPS


JULY 1 —DMI Morning Maps—


“Spin” continues to brew up southwest of Iceland, as “Ach” remaons weak over Svalbard. The other main feature continues to be the high pressure over the Arctic Sea, and its quasi-zonal flow.
A “heat wave” is occurring north of Alaska, with temperatures up over plus five. The ice is pretty thick there, but must be slushy. The sub-freezing pool continues to be in the Kara Sea.
NORTH POLE CAMERA —The gray thaw resumes—


The top picture is from 9:30 PM last night, and the bottom is from 3:30 AM this morning. The snow is again starting to look grayer, which is indicative of slush. The lead continues to remain wide, and the satellite pictures show many cakes of ice jostling together in a packed sea. I’m not sure it is right to call the lead a “lead” any more, as it is less like a crack in solid ice and more like water between floating islands, but I’ll keep on calling it a “lead” for the sake of consistency.
You can click these pictures for greater clarity. Then I like to use my magnifier to hunt for seals and polar bears, and other small details in the distance.
9:30 AM —Gray, gray, gray. Will it never get blue?—
 It up near 90 (32 Celsius) here in New Hampshire, which is the weather I used to go to the North Pole Camera to get relief from. However in my memory the Pole was turquoise and silver, not this gray all the time. It must be the blasted cosmic rays making cloud particles, due to the Quiet Sun. (Or maybe cloud particles from soot from China burning coal.) (Who should I blame today?) In any case, it is noteworthy that there have been more clouds this year, on the Atlantic side of the Pole, at least.
That large berg in the lead isn’t moving. I can’t see much motion in the overcast either. It must be fairly calm at the moment. (This is one of four pictures taken 2-3 minutes apart. You can go see them fir yourself at http://psc.apl.washington.edu/northpole/NPEO2014/webcams1and2.html )
3:30 pm —NOTHING HAS BUDGED—

Nothing has changed. Not even the berg in the lead has moved. This is odd, for winds have picked up a little, from 9 to 14 mph, mostly from the east, as our camera has chugged steadily west, and inched a little bit back to the north, ending the day at 85.204°N, 13.370°E. Temperatures began and ended at +0.5°C, edging up to the day’s high of +0.8°C at 3:00 AM and edging back down to the low of +0.4°C at 9:00 AM. Pressure has raised only a hair to 1015.4 mb. I suppose the scene looks still because we are in a steady, slow flow from the east. It is when winds are shifting that the ice starts jostling.
JULY 1 —DMI Afternoon Maps—


NORTH POLE CAMERA IN DANGER FROM NEARBY PRESSURE RIDGE

The jumble of a pressure ridge’s crushed ice is clear at the right margin, despite the dim light. Also the horizon is tilted, which means the camera is tilted a little.
The ice in the lead has pushed to the left a little. I’m not sure what the black things on the ice are. Seals?
JULY 2 —DMI MORNING MAPS—


NORTH POLE CAMERA —NO PICTURES—
There have been no pictures since 9:30 last night. Alas, things do not look good at the moment for the camera. Perhaps it really was “crunch time.”
We continue to get reports on its position and on weather conditions. The ice continues west, and to nudge north, and at noon was at 85.230°N, 12.598°E. This motion crunches ice back towards the Pole rather than flushing it south, out through Fram Strait. We are further north than we were a week ago.
Temperatures have risen slightly, hitting the days high of +0.8°C at several times, and at +0.7°C at noon. The pressure has risen just a hair to 1016.8 mb and winds have slackened slightly to 5-10 mph.
JULY 2 —DMI AFTERNOON MAPS—


JULY 3 —DMI Morning Maps—


“Spin” is parked over Iceland, playing the part of an Icelandic low to excess. The Azores-to-Pole ridge of high pressure is now shattered and exists no more. Weak low pressure extends east from “Sprin” to unnamed and weak low over the Gulf of Bothnia in the northern Baltic Sea, and on from there to a weak low over the Kara Sea. These two lows have some dim relation to “Ach”, formerly over Svalbard, as an occlusion and a “zipper,” but also gained strength from the south. High pressure remains over the Pole.
STILL NO PICTURES FROM THE NORTH POLE CAMERA
This is depressing me. How am I to base this post on views from a camera likely buried in a pressure ridge? Perhaps I am being freed of this self-imposed obligation, by the powers-that-be. After all, it is Independence Day, tomorrow, here in the United States.
I’ll think of something.
JULY 3 —DMI AFTERNOON MAPS—


I’m surprised at the overnight chill that appeared on the Canadian side.
“Spin” is occluded and spinning its wheels over Iceland, with an eastward extention of low pressure to “Ach”, weakening over Scandinavia, and on to “Achzip”, strengthening on the central Siberian coast over the Kara Sea. Despite “Spin’s” size, there is no surge of warm air north into the arctic around its eastern side, and instead a long fetch of Atlantic wind aims across southern Scandinavia, as east wind prevail along the northern Scandinavian coasts. Our crunched camera looks to be in calm seas.
I’m curious to see the UK met view:
A QUICK GLANCE AT THE UK MET
 (CLICK TO ENLARGE)
This map shows the long fetch into the Baltic. Though “Spin” assists the Gulf Stream halfway up the coast of Norway, isobars suggest winds counter any southern influx of water north of there. Curiosity has me look to see what this models next Monday as looking like:

This shows “Spin” still stalled, and rather than a surge of warm air up over the Pole a Scandinavian high is building south. Our crunched camera may again be in light southerly winds that are not overly warm. On the other side of the Scandinavian high “Achzip” may be the next low to attempt to attack the Pole, though it is not seen as getting more than half way there.
By the way, the low southwest of Greenland in this map is Hurricane Arthur. I likely should be paying attention to that, as it is to my south. However it is so hot and muggy here I prefer the Pole.
CRUNCHED CAMERA —LIGHT WINDS AND BRIEF FREEZE—
Light winds of 4-7 mph swung slightly northeast, and our northward progress ended at 3:00 PM yesterday at 85.230°N, as we continued east to wind up at 85.209°N, 12.139°E at noon today. The wind shift brought temperatures down from a high of +0.8°C at 6:00 PM yesterday to a low of -0.4°C at 6:00 am, but then temperatures bounced back to +0.8°C at 9:00 AM and remained there at noon.
NOTE TO ALARMISTS—CAMERA WAS CRUNCHED BY ICE COLLIDING; NOT MELTING.
I figured I should make that point clear. The ice was pulverized at the Pole back when temperatures were at minus twenty, and had to do with a stormy pattern, and a Polar flow that was meridian rather than zonal. I figured I should say that because I’ve been watching all winter and spring, and also because I imagine a hoopla could arise when word gets out the camera is kaput. Just remember the last picture showed a jumble of ice appearing from the right.
CRAVING A CAMERA —Obuoy #10, north of Alaska at 77 north, 155 west—

The ice is getting slushy over there, and it looks pretty gray. Where’s my views of turquoise and silver? When it is hot and muggy here in New Hampshire, with dew points above 70, I prefer the shining arctic, not this gray stuff.
By the way, this buoy is nearly 500 miles further south from the Pole than our crushed camera, so you expect slush in July. However the real melting comes from below, and this far south I’ve seen the ice break up in September even as the top starts to refreeze and be covered with drifting snow. The ice here was 1.40 m thick when the camera was deployed last September 28, and is currently 1.62 m thick. It’s drift map is interesting, for it has looped around and defies the “Beaufort Gyre”, a “wrong way” buoy.
 (Double click to fully enlarge.)
JULY 4 —DMI MORNING MAPS—


JULY 4 —DMI AFTERNOON MAPS—


“Spin” continues to weaken as it wobbles by Iceland, but is swinging a bunch of fronts with wind and rain over England, as it looks like warmer air is being shoved up into Scandinavia, with a warm front struggling half way north across the Baltic before fading away on Sunday. Meanwhile Achzip lurks in the Kara Sea, probing towards the Pole.
The surprise (for me) is the cold appearing on the temperature maps. While it is not by our crunched camera, it is significant enough to dip the DMI Graph back towards zero. (click to enlarge)
THE CRUNCHED CAMERA REPORT
Light winds of six to nine mph have continued to push our crushed camera south and east, to 85.140°N, 11.925°E. Temperatures dipped to a low of +0.1°C at 9:00 PM last night, and were still at +0.2°C at 6:00 AM this morning, but then soared to +1.0°C at noon. (OK, perhaps “soared” is a bit of purple prose, but it is hard to make the stagnation of summer temperatures very exciting.) In any case that is the warmest we’ve seen this summer. Pressures have slowly fallen to 1015.3 mb
A NEW NORTH POLE CAMERA?
This is the picture from O-buoy #9, just across the Pole. It has come drifting up from the south to roughly 88 north latitude and 157 west longitude, which is closer to the Pole than our crushed camera is.
I know it is terribly fickle to ditch the North Pole camera, especially considering the arduous conditions, the bitter blizzard winds and danger of bears, faced by the brave men who set those cameras up, but hey, they fell down. Anyway, this camera has turquoise and silver, and who can resist that?

In case you don’t know this camera, it was set up late last September down around 80 north and 105 east, which is about 2/5th of the way across from the New Siberian Islands to northwest Alaska. The landscape was very flat and boring. They shut the camera down in the winter darkness, and when they turned it back on in the spring all the interesting pressure ridges had appeared. Then, at the end of April, that nasty crack appeared, practically under the yellow buoy. That does not bode well for the future, though some of these buoys take pictures even when they are dumped into the sea, as they are on buoys that bob about.
O-buoy 7 was great fun to watch last summer, eventually getting dumped into the sea and sailing into truly ice-free waters before wind blew it back north and the expanding sea ice gobbled it up again. (It is still up there, but sadly they haven’t been able to get the camera going this spring.) Watch this entire movie if you have 12 minutes to blow, or just the period after ten minutes if you are pressed for time: http://obuoy.datatransport.org/monitor#buoy7/movie
JULY 5 —DMI MORNING MAPS—


“Spin” remains stalled over Iceland. It now has two centers, as it sucked in a secondary low which has wheeled around to its north. These two centers are going to orbit each other like the two stones of a bola, as the entire system gradually fades away by next Tuesday. Then it looks like the Azores high will try to probe north and attempt to rejoin the arctic high, and recreate the mid-Atlantic high pressure ridge, but the remnants of Hurricane Arthur will be attacking from the west, so we’ll have to wait and see who wins. In the meantime a general south and southeast flow is coming up over Scandinavia, then swinging east and then south along the coast of Greenland, and never mounting a proper warm invasion of the Arctic. “Spin” can’t make any headway into this flow, and its fronts will have a hard time crossing England and getting to Denmark and southwest Norway. Eventually a sort of zipper will kick under the flow, and a secondary will wander up from the Mediterranean and strengthen south of the Baltic on the Poland-Germany border, around Tuesday. This will only add to the southeast flow over Scandinavia, and add to the repression of the northern remnants of “Spin.” This southeast flow will press against a cooler easterly flow along the arctic coast of Scandinavia, and likely will create a weak front with weak lows along the very top of the Atlantic, acting as a lid on warm invasions. To the north of this lid our crunched camera will remain blithely unaware of the hubbub to the south, and sit in relative stillness.
Over in the Kara Sea “Achzip” will try to attack the Pole, but be bent back by a ridge of high pressure that builds from Finland to Alaska. However, if you trust the longest range forecasts (and you shouldn’t) there is a chance remnants of Hurricane Arthur may make it to the Pole a week from Monday. (Even if it is unlikely, it would be cool to see that happen.)
NEW CAMERA—OLD GRAY VIEW

I don’t know about you, but I’m curious as to what the Albedo-crowd has to say about this gray, gray summer.
JULY 5 —DMI AFTERNOON MAPS—


It looks mild in Scandinavia. I wonder if that warmth could fuel a storm… or is it too dry. I need to hire a reporter.
THE CRUNCHED CAMERA REPORT
Our wreckage continued southwest, to 85.099°N,11.884°E at midnight, before wandering southeast to 85.075°N, 11.916°E at noon. Winds were briefly up over 10 mph yesterday but had slacked off to less than 5 mph at noon. The high temperature was +0.7°C at 3:00 PM yesterday, and then the thermometer fell erratically to -0.1°C at 9:00 Am today, before bouncing back to +0.6°C at noon. The barometer remained boring, dipping slightly before rising to 1016.7 mb. What we need around here is a hurricane, to liven things up.
NEW CAMERA —IN THE PINK—

I wasn’t going to bother bore you with another view of gray, when I noticed a hint of a tint, pink, I think. This demonstrates how low the sun is up there. Even at noon sunset enchantment colors the clouds. The twenty-four hour days are a sunrise never over, and a sunset never done.
JULY 6 —DMI MORNING MAPS—


One of the mildest maps we’ve seen, with most of the sub-freezing air relegated to the northern Kara and northwest Barents Seas. “Achzip” is swinging a bit of mild air up into the Laptev Sea, but there also seems to be some colder air in that flow from East Siberia. Our crunched camera seems to be just out of the reach of “Achzip’s” winds, in a more tranquil area.
“Spin” is continuing to weaken, as weak secondary and tertiary lows make no progress against the high over Scandinavia, and are shunted beneath. I guess I’ll call the tertiary “Spinthree,” and it will be parked south of the Baltic at the start of next week, keeping Scandinavia in a mild flow from the east. So far little of this mild air has made its way north to the arctic, and rather is recycled south by the flow around “Spin.”
THE FINALLY AGONY OF THE CRUNCHED CAMERA ON FILM
I thank the blogger Max™ for putting together the static pictures in a way that shows the final crunch that crunched our polar view, and sent us like orphans out over the ice, looking for a new window to that world.
http://cdn.makeagif.com/media/7-05-2014/Kin74G.gif
THE CRUNCHED CAMERA REPORT —Below freezing—dubious data?—
Our mangled piece of junk continued slowly south and west, to 85.063°N, 11.823°E, in winds that dropped to a calm for a while and produced some odd data. At 6:00 PM last night, when winds were dead calm, the thermometer abruptly read +4.1°C, when the above DMI map shows no temperatures that high in the area at midnight. (If there were, they would be a more yellow hue.) Hmm. By midnight the reading dropped to -0.5°C, and by 6:00 AM it was down to -1.7°C, and then rose some to -1.1°C by noon.
Hmm. It occurs to me that, if our camera is crunched, the buoy we used to look at might be tipped over on its side. The sun, at a particular angle, might hit the thermometer through a entry not usually exposed to direct sunlight. We’ll have to see what happens at 6:00 PM tomorrow. (I’m not sure I trust the low temperatures either, as they are suspiciously close to the temperature of the salt water, and half the buoy may be submerged, even as the wind-vane and anemometer still are in the air.
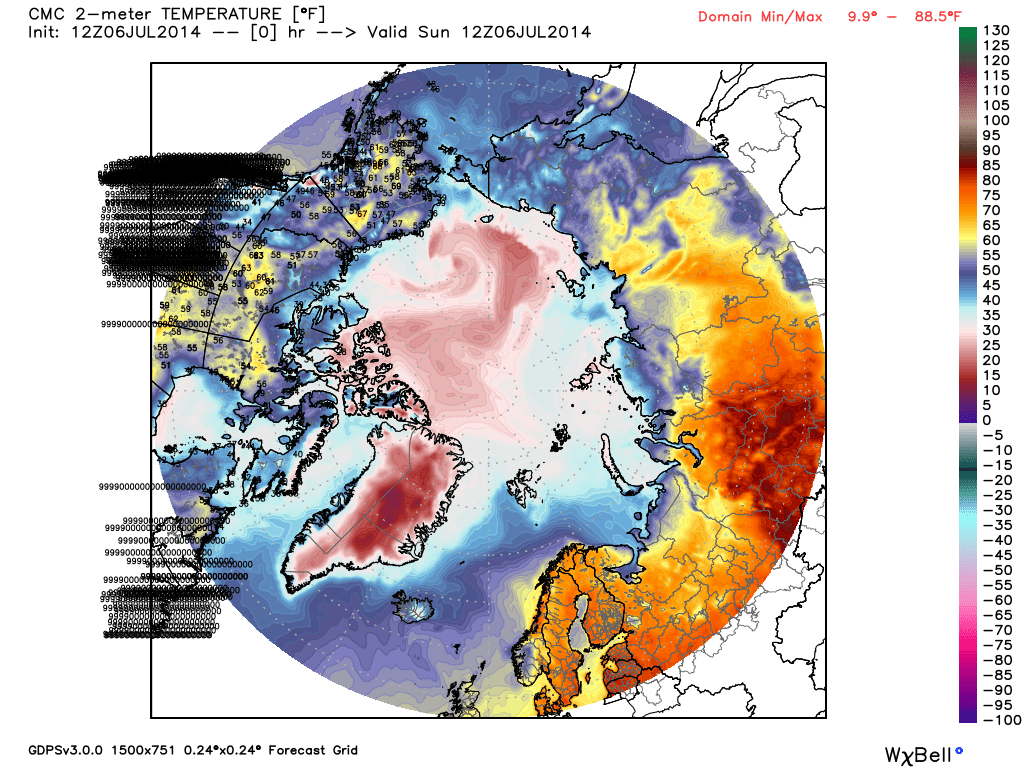
I merely became more confused when I consulted the initial 0000z runs of various computer models, as they all showed colder temperatures than the DMI map above. Most striking was the Canadian JEM model.
 (click to enlarge)
All the pink is below-freezing in the above map. (Temperatures are fahrenheit) Don’t the models use the same data for their initial runs? Oh…wait…that is the 1200z run. Never mind.
The barometer at our ruin has slowly risen to 1018.7 mb.
NEW CAMERA —Oh brother! Now this site is stressed!—
You will notice the large yellow trash can has started to list to the starboard, as the crack under it grinds. What next??? Stay tuned!!!
JULY 6 —DMI AFTERNOON MAPS—


“Spin” continues to weaken over Iceland, even as it incorporates a second secondary, as a weak low north of Iceland. The third secondary is barely nudging a front against the southwest coast of Norway, but likely to be blunted southeast into what will become “Spinthree.”
“Achzip” is also weaker, and is being backed away from the Pole by a growing ridge of high pressure. The high pressure north of Canada is joining hands with the high pressure over Finland and east Siberia. I’ll dub this feature “Trans”, for “transpolar high pressure ridge.”
(In case you are wondering, my names do make sense. A storm named “Spinach” crashed into Greenland and split, so I named the two blobs “Spin” and “Ach” Get it?)
(If a storm has an obvious secondary, it will get the suffix “son,” but if the son is born along an occlusion zipping east along the warm front it gets the suffix “zip.”)
However, though my names make sense, I am having trouble making sense of the differences in the temperatures between the Canadian 12z “Jem” map, and the DMI map, above. It may only be a degree of difference, but that degree is the difference between H2O being ice or water. If anyone can explain it, I’d be all ears.
It does look like it might be +4° just north of Svalbard, and close to -2° just south of the Pole, but how our crushed camera could experience both these extremes. with winds so light, is a mystery to me.
(As an investigatory reporter my duty is to ask more questions than I can answer. I wish the mainstream media would learn to do this.)
A HINT OF THINGS TO COME?
I am not expecting the ice-extent-graphs to stop dropping until the non-arctic ice is all melted. Ice in some places is always melted, every summer, such as off the east coast of Russia. In other places it melts nearly every summer, such as in Hudson Bay. Only when this outlying ice is gone do I expect the ice-extent-graph to stop plunging, and, because the ice in Hudson Bay is still melting away, I did not expect the uptick in the DMI graph:
 (click to enlarge)
JULY 7 —DMI Morning Maps—


NEW CAMERA —Nice picture—

It’s a gray Monday down here, but not up there.

CRUNCHED CAMERA REPORT —More mystery—
In light airs less than 5 mph and occasional calm our crumpled hunk of industrial waste continued southwest to 85.041°N, 11.691°E. The barometer continued rising to 1025.2 mb. Temperatures were reported below freezing all through the 24 hour period, except for another mysterious spike. After arriving at the low of -2.2°C at 3:00 AM it spiked to +3.1°C at 6:00 AM and was back down to -0.5°C at 9:00 AM, finishing the 24-hour-period at -0.6°C at noon.
What could cause such a spike? Like yesterday’s, it occurred when the wind was dead calm, however the sun was 180 degrees around in the sky, hitting from the exact opposite side. Hmm. Is their some slot in the structure of what holds the thermometer, running from side to side so that the sun only shines in the slot when it is at opposite sides of the sky? Or are such pools of milder air common, when winds slacken at the Pole?
I prefer to let my imagination run wild, and to picture that a ruptured tank on the side of the tilted buoy has vomited some fetid black substance onto the pristine ice, and when the wind dies it creates an urban heat island. After all, when your lying eyes can’t see, who knows?
(I figure if I can get some good internet rumors going, they might helicopter a guy up from a nearby icebreaker to fix those cameras.)
JULY 7 —DMI Afternoon Maps—


Right off the bat I notice that, though our crunched camera reported a 12z temperature of -0.6°C, this 12z map shows no such cold in that area. Oh well, what’s a degree between friends?
The high “Trans” is the big feature, as both “Spon” and “Achzip” weaken. The low pressure southwest of Greenland is remnants of hurricane Arthur. Scandinavia is getting some warm east winds, and looks like it will continue to get warmth for some time. So far that heat hasn’t made it north to the arctic.
UK MET MAPS —East winds over Scandinavia—
It is interesting that the east winds that give the Baltic its worst cold in the winter give the warmest weather in the summer. It shows you how hugely the conditions on the Russian plains change, and the importance of understanding the conditions in the “source regions” air-masses originate in.
The Tuesday initial map shows that after a week or work, “Spin” was only able to push its front into southwest Scandinavia, and it is now being rejected and pushed back west as a warm front. To the north of “Spin” orbits “Spinson,” and down the front over Germany is “Spinthree,” which is getting a good flow going across the Baltic, working in conjunction with a Scandinavian high, which is an extention of “Trans” across the Pole. The remnants of Hurricane Arthur are southwest of Greenland.

If we look at the forecast for 24 hours from now we see both “Spin” and “Spinson” have largely filled in, or perhaps been absorbed west and east, as a ridge rebuilds briefly up between the Azores and the Pole. My guess is this ridge will be transient, as it is getting attacked from both sides. To the east the flow from the east above “Spinthree” through the Baltic has become more pronounced, and it is headed west towards a show-down with the flow from the west beneath “Arthur,” (which is breaking into two chunks, “Art” and “Thur”).

“Spinthree” looks like it will not move, part of a blocking pattern, while “Thur” looks like it part of a progressive pattern. The two patterns will have a difficult time being politically correct, and coexisting. Perhaps they will be polite, and the east winds will pass to the north as the west winds pass to the south, however the North Atlantic is not always so polite. The meeting of east and west will be interesting to watch.
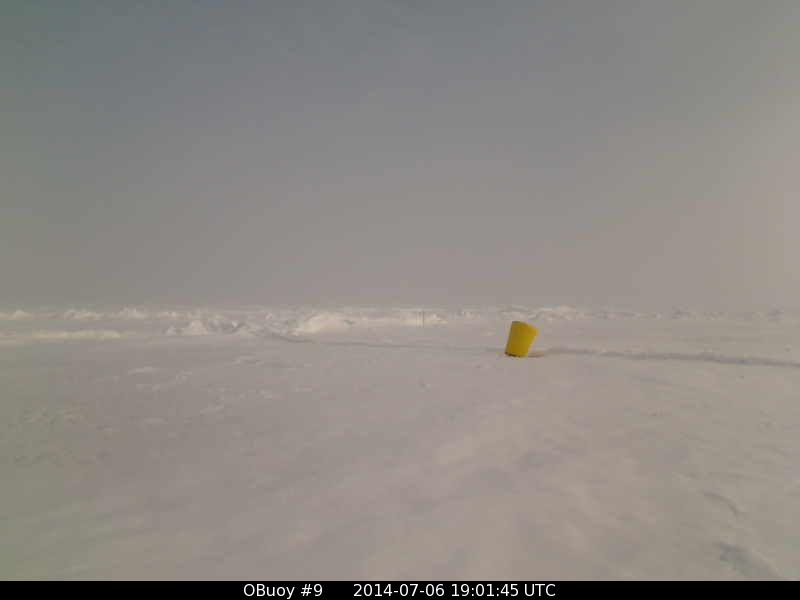
JULY 8 —DMI Morning Maps—


“Trans” is the main feature. The one thing apparent in this view, unapparent in the UK Met View, is the long fetch developing along the Siberian coast, introducing the possibility of cooler air in northern Scandinavia. (Also “Spinson” looks decently strong on this map, and it is hard to believe it will be gone tomorrow.)
It is noon towards the top and midnight towards the bottom, which partly explains the lack of sub-freezing temperatures towards the top. Once again, however, you get a cooler picture from the initial run of the Canadian “Jem” model from the same time:
 (Double click to fully enlarge)
Perhaps I should use my lying eyes.
NEW CAMERA —Sunny but cold—

Temperatures here at O-buoy 9 are just below freezing, though the snow looks a little softer under the bright sun. Now let’s travel roughly 650 miles south down towards Alaska, to O-buoy 10 at latitude 77:

That sure is a slushy scene, and more typical of Arctic summer. Temperatures here are just above freezing. (American and Russian scientists [and spies] used to spend summers on “ice islands” in the arctic, back in the time of the cold war, and they stated the slush could be difficult to walk through, for at times it was over knee deep.)
ADJUSTED NOAA CVSv2 FORECAST
 (Double click to fully enlarge)
This forecast is still amazing, though they tweaked it to better resemble reality. Now, rather than predicting the anomally will change from -.6 to +.6 million km2 by August 1, they predict it will swing from -.9 to +.5 million km2. Pretty gutsy forecast, considering they only have 23 more days to see it actualize.
ARCTIC DETAILS —Open water in Laptev Sea—
During last winter and early spring the cross-polar-flow blew a lot from Siberia towards the Canadian Archipelago, and while this jammed ice up against the Canadian coast and made it thick on that side, it was blowing ice away from the Siberian coast, often creating open water along the Laptev Siberian coast even in the coldest part of winter. As a consequence that sea has been swift to melt this spring and summer, and has .2 million km2 less ice than expected.
 (click to enlarge)
The red line in the above graph shows how far below normal the ice coverage is. If you look back to last summer you can see that even if the entire sea is ice-free in late September, that will only be .2 million km2 below normal. So the Laptev situation will likely only be a blip in the minimum totals. Also, the ice to the north is thickly packed, and a north wind in September could spread that ice south and cause upturns in the Laptev extent, which puzzles people who assume this means ice is growing in above-freezing temperatures, when in fact it only means ice is shifting.
Another interesting feature is that ice in the Greenland Sea is .1 million kn below normal. Rather than meaning the arctic extent is less, this actually suggests less ice is being flushed out through Fram Strait and down Greenland’s east coast, indicating more ice is being left up north to increase the extent.
The extent in the central Arctic Basin is between .26 million km2 above normal.
You can check out the graphs for all the various seas at http://arctic.atmos.uiuc.edu/cryosphere/IMAGES/recent365.anom.region.1.html
Go to the map at the bottom of the page to switch from sea to sea. Also be aware Cryosphere Today has Alarmist tendencies, and tends to favor warmer data, and may be using the satellite version that sees slush as open water.
NEW BUOY —LOVELY DAY, BUT CLOUDS CREEPING UP—

CRUNCHED CAMERA REPORT —A turn around—
The wind-vane apparently is still working, for it reported a 180 degree swing, and the ice did start moving the opposite way. Our westward movement stopped at 11.621°E at 3:00 AM, and our southward movement stopped at 85.021°N at 9:00 AM, and we ended the day at 85.023°N, 11.682°E. Once again we didn’t quite cross 85 degrees latitude.
The light airs continued at less than five mph until the noon reading, when a light breeze of 9 mph was reported. The temperature barely broke freezing, and only briefly, yesterday at 3:00 PM, when temperatures touched + 0.1°C. By 6:00 PM they were down to – 0.4°C, and continued down to -0.8°C at 3:00 AM, rose to -0.3°C at 9:00 AM, but then surprisingly dropped to -1.4°C as the wind picked up at noon. This is no way to run a thaw.
The barometer crested at 1027.6 mb at 3:00 AM, and has since fallen slightly to 1026.2 mb at noon.
JULY 8 —DMI Afternoon Maps—

JULY 9 —DMI MORNING MAPS—


That low atop Greenland is a bit of a surprise. I’m going to call it “Art,” because it is in a small part due to the “morphistication” of Arthur, transiting Greenland south to north, and by using the art of imagination, I can do what I want, as this is my blog. In actual fact it likely also has a lot to do with the mild air pouring across Scandinavia, and not being able to penetrate northwards into the Arctic. While some of this mild air was ocean-cooled and sunk, building high pressure at the surface, it also formed a weak boundary between the Atlantic and Arctic, (which is more obvious on last night’s map). I think this boundary was enough of a frontal clash to fuel “Art”, making him stronger than I recall any model foreseeing. For the moment the southerly flow east of “Art” and west of the building high pressure in the Atlantic will push ice the “wrong way”, north in Fram Strait. Also this will at long last allow at least some mild air up over the Pole.
It looks like “Art” will divide “Trans,” and one part of the high pressure will drift down into Canada while the other part hangs tough in Scandinavia. While some cool polar air may push a front into northwest Finland, most of Scandinavia will remain in the mild flow between “Trans” and the stalled low “Spinthree” south of the Baltic. This mild flow, from the Steppes to the east, which will continue pouring west to meet the progressive flow across the Atlantic from the west coming east, (including the other half of Arthur, milling about south of Greenland). (I’ll call that half “Thur”.)
As “Art” divides “Trans”, “Art” will drift out over the Pole, which will allow me to say that Hurricane Arthur wound up over the Pole. Although this is “wish-casting” of the worst sort, it comforts me. There are few places on the planet I have the slightest bit of control, but this post is one of them.
NEW CAMERA —Cross polar view—

Judging from the position of the sun and the time stamp, the North Pole is roughly beneath the sun, or perhaps a little to the left. We are looking past the Pole,a little to the right of our distant crunched camera, towards the far off Atlantic, and eventually jolly, old England. “Spin” is located to the right margin, and the clouds are swinging around and coming north on “spin’s” warm side. The snow looks a little softer, but there is no sign of slush yet. To see our first genuine melt-water pool we need to look over our left shoulder, backwards, down to O-buoy 10, down at 77 degrees south:

There are roughly ten feet of ice beneath this pool, however if the satellite is still measuring using its “winter-mode,” it will see the pool as open water.
JULY 9 —DMI AFTERNOON MAPS—
For some reason they haven’t updated these maps, so I guess I’ll go and have a
QUICK CHECK OF THE UK MET

A very interesting map, with the east about to clash with the west, and England in the middle. A strong easterly flow is crossing the Baltic north of “Spinthree” in Germany, as a westerly flow scoots under the occluded wreckage of Hurrican Arthur, in the process of forming “Thur” south of Greenland. The long fetch we saw in this morning’s DMI map, aloing the Eurasian side of the high pressure “Trans”, has managed to push a cold front into Finland, but the rest of Scandinavia appears warm, and I’, curious to see whether any of that warmth has been pushed up to our crunched camera by the circulation of “Art”, north of Greenland.
CRUNCHED CAMERA REPORT
Temperatures did rise, from -1.2°C at 3:00 PM yesterday to +1.2°C at 3:00 AM this morning, as winds rose to more than 20 mph. Then, as winds slacked off to 9 mph the temperature fell to +0.4°C at noon. The pressure fell steadily to 1010.1 mb. Our northwest movement persisted until 9:00 AM, when we reached 85.121°N, when a .002° southward bump was registered, and we ended the 24 hour period at 85.119°N, 12.375°E.
That .002° southward bump seems curious, as the other maps I’ve looked at make it seem the flow should still be southwest, though the wind-vane shows a wind-shift to the north. I guess I should check the new camera.
NEW CAMERA —Gray overcast moves in—

It looks like “Art” has brought some moisture up to the Pole. I’m curious to see if the warmth all stays aloft, and the surface gets colder. Temperatures at this buoy appear to be right at freezing. (They have a graph rather than a number.)
Now let’s check out O-buoy 10 and see how the melt is getting on down there.

Well, it is not big enough to call “Lake North Pole” yet, and also, at latitude 77, it is a bit far south, but as it expands it may get some media coverage. As the ice is roughly 10 feet thick, this melt-water pond could get fairly large before it finds a crack and drains down. What is neat is when a single hole drains a large area, for then it forms an interesting veined, spiderweb pattern, with all the branching streams leading inward to a single drain.
Some sort of rivulet seems to be starting to flow, in this picture.
There tends to be more melt-water ponds this far south. The thing to remember is that back when the PDO was constantly warm (it is currently in a brief warm “spike”,) the ice here was thinner and fractured into many flat pans, each of which had many ponds on it. Here is a picture from that time:

If the Alarmist contention that the icecap is melting away was founded in fact one would expect the floating pans to now be fewer, with more water between them, and for them to be thinner. In fact the Navy map shows this same area to now be covered in fairly solid ice (with some leads) that is much thicker:

JULY 10 —DMI MORNING MAPS—


“Art” is moving out towards the Pole as a new low, “Tev”, pushes out from the other side into the Laptev Sea. They have split “Trans” into two separate high pressure systems, with the one over Scandinavia the stronger. The Pole looks the warmest it’s looked all summer, yet still isn’t quite up to normal.
NEW CAMERA —Gray day—

It is hard to find much of interest in a gray picture, but that yellow object, (which I have decided is not a trash can but a cork), is moving. First it swiveled around so we could see its top, but now seems to be starting to rotate back.
Judging from the Navy drift-map, we are moving towards the Canadian side, as the ice across the Pole down at our crunched camera is moving the other way. This likely would open a lead between the two sites. Also note that in Fram Strait the sea-ice is flowing into the Arctic rather than out. The ice shifting about has created a situation where there is ice off the northwest coast of Svalbard in the height of summer, where there were ice-free waters, in the dead of winter. (Notice that Hudson and Baffin Bay are nearly ice-free; from here on in it will be harder to reduce “extent.”)
 (Double click to fully enlarge)
CRUNCHED CAMERA REPORT —HEADING NORTH AGAIN—
Our shocking piece of pollution blotching the pristine snows continued steadily east, but its southward motion ceased at 85.106°N at 9:00 PM last night. The wind had died to less than 5 mph, and temperatures reached the low for the 24-hour-period of -0.7°C. Then, as the winds swung from wnw to wsw and rose to 9 mph, temperatures rose to the day’s high of +0.9°C at noon, when our camera’s position was 85.117°N, 12.628°E. The barometer slowly fell throughout the period to 1006.3 mb.
It is interesting how calmer conditions seem to lead to colder temperatures, as if the air in contact with the ice and seawater is chilled, and the air not very far up is warmer, and higher winds stir the air more.
JULY 10 —DMI Afternoon maps—


“Art” is nudging towards the Pole as “Tev” wallows out into the Laptev Sea, completing the break of “Trans” into two high pressure systems, with the Scandinavian one subdividing further due to what likely is a front between polar air and highly modified air from the Asian Steppes. Further south “Thur” is getting his act together southeast of Iceland.
The temperature map shows the summer thaw underway over much of the Arctic Sea, though temperatures remain a hair below normal. The sub-freezing air towards Canada is because it is after midnight in that quadrant, and the sun is either very low or just below the horizon. Interestingly, that is where O-buoy 10 is located, and right by where O-buoy 9 is located is a single spot of sub-freezing air near the Pole. There is also sun-freezing air in the Kara Sea but it, like much of the cold north of Canada, is south of 80 degrees and does not show up in the DMI graph.
 (click to enlarge)
QUICK GLANCE AT UK MET
What is fascinating about this map is that, south of “Spinthree” over Germany, Atlantic air has streamed east over the Alps and nearly to the Black sea, while north of Spinthree air from the Steppes has pushed west nearly to England. It is a sandwich. Despite the fact the high pressure ridge “Trans” has been broken, the long fetch it had along the Siberian coast is pushing a cold front down into Finland.
 (click to enlarge)
The next map is 12 hours later and twelve hours after the above DMI maps, and shows the polar front pressing further south through Finland, on its way to eastern Sweden and eventually Denmark, where it will have briefly pinched off the flow of warm air from the Steppes. However models show that Spinthree will intensify towards the Black Sea and send another surge of air from the Steppes into the Baltic next week, pushing the cold front west as a warm front.
Across the Atlantic “Thur” is brewing up and will stall as a sub-1000 mb low over Iceland, with west winds shoving a series of fronts and occlusions to meet that warm air from the Steppes, and models show that warm air pushed back east and north, as Atlantic air gets into the Baltic around midweek.
Perhaps we can then get into a more zonal pattern, where storms behave as they are suppose to behave, and trot around the Arctic Circle from west to east in a polite and politically-correct fashion. However perhaps models are showing that solution because they are programmed to be correct. They are not used to weather misbehaving, and have scored badly, in terms of correct solutions, so far this spring and summer.
 (click to enlarge)
NEW CAMERAS —POCKETS OF COLD—
Besides showing that the yellow cork has really flopped over, O-buoy 9 seems to show a slight dust of snow has fallen. This will reflect the sun and slow the thaw.

Down at O-buoy ten, the lowness of the sun at midnight seems to have allowed a skim of ice to form on the edges of the melt-water pools, hindering their growth briefly even as the sun rises higher, however I expect the melting to swiftly resume.

JULY 11 —DMI MORNING MAPS—


Although “Art” is weak, it marks yet another low sitting atop the Pole, king of the world. I like to think it contains a vauge impulse of Hurricane Arthur, though most of Arthur’s moisture is wound up in occlusions in “Thur,” by Iceland.
The winds must have turned north by the northeast coast of Greenland, to have sub-freezing temperatures there.
NEW CAMERA —DRIZZLE?—

The snow looks grayer and more like slush to the left, and I think there may have been rain or drizzle, which is not all that uncommon in July at the Pole.
CRUNCHED CAMERA REPORT
No report today. Maybe the buoy got crunched as well.
JULY 11 —DMI AFTERNOON MAPS—


It is interesting how quickly the ridge across the Pole turned into a trough across the Pole.
NEW CAMERAS —GRAY SKIES—


Busy with some other writing tonight. Will comment tomorrow.
JULY 12 —DMI MORNING MAPS—


NEW CAMERAS —snow north, thaw south—


JULY 12 —AFTERNOON DMI MAPS—

JULY 13 —DMI MORNING MAPS—


“Art” is stalled at the northern edge of the Kara Sea, which continues to be cold and show sub-freezing temperatures. I thought “Tev” might be attracted to “Art” and they might do a Fujiwhara dance around the Pole, but I was wrong, as Tev has drifted across to Alaska and now will drift along the coast to Canada, as high pressure builds between it and Art. That high pressure will build more strongly between Art and “Thur”, which is stalled over Iceland. This high will build as Art and Thur fade away, curving east winds along the Scandinavian north coast and then north up through Fram Strait, pushing the sea-ice back up the “wrong way” again.
QUICK GLANCE AT THE UK MET

The map continues to show the interesting sandwich, with Atlantic air to the south heading towards the Black Sea, and warm air from the Steppes moving east through the Baltic, with Spinthree directing traffic between the two. However Spinthree is getting weak, and it looks like it will wobble back to southern Sweden and redevelop a bit, with east winds retreating north and west winds actually managing to drive an Atlantic cold front into the Baltic by midweek. That little low back towards Newfoundland, “Thurthree,” will ripple east under “Thur” to Norway by Wednesday. Meanwhile Thur and its secondary “Thurson” will back towards Greenland. Some models show Thur actually moving inland over Greenland and contributing to the south winds in Fram Strait.
CRUNCHED CAMERA REPORT —Two days data—
Winds have been swinging around to the north behind “Art,” and our northward progress came to a halt at 85.121°N at 3:00 PM on the 10th. Our eastward progress came to a halt at 13.439°E at 9:00 Pm on the 11th, and by noon yesterday we had drifted back to 85.031°N, 13.096°E. We should get south of 85 degrees latitude for the first time before the winds shift south again, as current northeast winds are light but steady, from 5 to 10 mph.
The barometer bottomed out at 1002.6 mb at 6:00 PM on the 11th, and had risen back to 1006.3 mb by noon yesterday. “Art” was by no means a big, ice-busting storm, but it did cut back on the sunshine.
The thaw seems to finally be getting serious about setting in, as we only had a single sub-freezing reading, -0.2°C at 6 PM back on the 10th, and since then it has been constantly above freezing, peaking at +0.9°C at noon on the 11th, and at +0.5°C at noon yesterday. This is no heatwave, but the sun never sets, and slowly the world we can’t see gets slushy.
I want to see. Time to check the other cameras.
NEW CAMERAS —Summer thaw setting in—

The ice looks just a bit more slushy to the left. Also there is a sign of an old crack on our side of the yellow cork, to go along with the crack just beyond it. We’re not likely to get a good melt-water pool with those cracks, as the water likely will drain down through weaknesses in the cracks. However maybe we’ll see this ice crack up, later in the season.

Fog! Now this could get some real thawing going. Fog condenses on the side of cold snow, just as humid air condenses on the side of a glass of ice-water in the summer. As the fog condenses it gives off its latent heat, which further hurries the melting, and is why fog is called a “snow-eater” in New England.
CRUNCHED CAMERA DATA
Our heap of junk finally crossed 85 degrees latitude, continueing south and west to 84.931°N, 12.818°E. Winds picked up a bit to the 10-15 mph range. Temperatures continued mild, with a low of +0.4°C at midnight and a high of +0.8°C at 9:00 AM, settling back to +0.7°C at noon. The barometer steadily climbed to 1011.2 mb.
JULY 13 —AFTERNOON DMI MAPS—


JULY 14 —DMI MORNING MAPS—

NEW CAMERAS —Contrasting weather—-

CRUNCHED CAMERA REPORT
Our demolished example of taxpayer funding continued south and west to 84.827°N, 12.389°E, as winds slackened to 9 mph, and the pressure continued rising to 1016.2 mb. The temperature remained nearly constant in the 24-hour daylight, twice hitting the 24 hour period’s high at +0.8°C at 3:00 PM yesterday and noon today, and the low at +0.5°C at 3:00 AM.
NEW CAMERAS


Though there is no sign of thawing yet in the picture from up at 88 degrees latitude, the background shifted at some point when I wasn’t paying attention. (I’ve been busy with a post that got printed today on WUWT.) There may be a second fault-line in that pressure ridge behind the buoy, and it is possible a lead may open up there.
The picture from down at 77 degrees latitude shows the thaw if full progress. You can see why it is omportant to have the satellite be able to tell the difference between open water and melt-water pools. My best guess is that the ice is ten feet thick under the pools.
JULY 14 —DMI AFTERNOON MAPS—


“Art” is fading in the Kara Sea as “Thur” fades over Iceland. The ridge across the top of the Atlantic will stop the export of sea-ice for a while.
Very warm over Scandinavia, as sub-freezing temperatures reappear by the Pole.
JULY 15 —DMI Morning Maps—


Lows are circling high pressure over Pole. “Tev” moving from north of Alaska to Canada, “”Art” that is weak over Kara Sea and moving east, and a new low “Sib” over Eastern Siberia, likely to cross to Alaska. However the most interesting feature is the high over Svalbard, likely to drift north of Scandinavia and create quite a “wrong way” flow south to north through Fram Strait all week.
Busy day at farm. I have two pigs coming. It is hot and muggy. I’d like to cool myself watching the ice melt, but won’t have time until later.
NEW CAMERAS


I couldn’t resist taking a quick peek at lunchtime, as it is so hot and muggy here in New Hampshire. By the way, the ice on the other side of the pressure ridge has shifted. It shifted to the left at 11:23 of the movie made by camera shots, and back to the right quite dramatically at 11:53 of the movie. So this ice is not as stable as it looks. Here’s the movie, if you want to see for yourself: http://obuoy.datatransport.org/monitor#buoy9/movie
*******
I figure this post is getting too long, so I’m going to start a new one. But I’ll post the first maps and pictures of the new post here, considering you have come all this way. However you may notice the tone of my writing changes a little, as I explain myself to first time viewers.
JULY 15 —AFTERNOON DMI MAPS—


These Danish Meteorological Intitute maps are put out at midnight and noon. I call them “morning” and “afternoon” maps because that is when I look at them. Because we are looking down on Earth, noon tends to be at the bottom and midnight at the top in noon maps, such as the above map, and the opposite is true in maps from twelve hours later. Though diurnal variation of temperatures has little effect in the 24-hour-a-day sunshine at the center, it does have an effect at the edges of the circle shown by these maps. For example, in the above map it is midnight towards Bering Strait, and the little pockets of sub-freezing temperature you see up there will vanish in the next map, and then reappear in the following map.
Although it annoys some people, I tend to name storms for the fun of it, and also it helps me keep track of them. From this angle of the earth it is possible to track the same system as it evolves, all the way around the planet. During the evolution systems go through during such journeys, I tend to have systems keep the same name even when a stricter meteorologist would say the original died and a secondary took over. (To them I say, this is my blog, and I’m boss here.) (Furthermore, I’m more reasonable than your boss, with his Global Warming fixation.) I very loosely follow a convention where secondary and tertiary storms on a front gain the suffix “son” and “three,” as they travel up the cold front, but when storms occlude and kick a storm ahead along the warm front I call it a “zipper” and use the suffix “zip.”
In the above map four storms are rotating around the high pressure at the Pole, which is a textbook situation, and unusual for this year, for we have often had lows over the Pole and you can then throw your textbook out the window. The low over Iceland is “Thur” and is stalled and fading, and the one in the Kara Sea is “Art” and also weakening. They are two faint memories of Hurricane Arthur. (Get it? Art and Thur?) The one over east Siberia is “Sib,” and the one approaching the Canadian Archipelago is “Tev.” Some models are showing Tev moving east as Art fades west, and a low of their merge forming over the Greenland icecap, which is unusual as high pressure likes to sit there. Rather than north winds on the east side of a high pressure, there ill be south winds on the east side of a low, and rather than sea-ice flushing out of the arctic through Fram Strait, it may be jammed back north. I use the word “may” because models are not always right, and also winds don’t always obey the isobars.
The sub-freezing temperatures over the Kara Sea have been persistent this summer, even in the afternoon.
CRUSHED CAMERA REPORT
The original point of these posts was to enjoy the views of the North Pole Camera as it drifted south, however we have had bad luck this year, as camera one was knocked over by a polar bear and camera two crushed by a pressure ridge. However the weather station is still working, and I give reports on what we are missing.
As the building polar high pressure shifts over towards Scandinavia we are experiencing changing conditions, before I expect we will be blown back north. Winds dropped to nearly calm, as the pressure crested at 1017.7 mb and then dipped to 1016.1 mb at noon. Winds fell to a long period of nearly calm conditions, and then rose to 10 mph at noon. The temperatures fell from noon yesterday’s high of +0.8 to a low of -0.2°C at midnight, recovered to +0.3 at 6:00 AM but dipped back to -0.2°C at 9:00 AM, before returning to zero at noon. These temperatures are below normal, though I expect they will rise as winds become south.
Our steady progress south and west was halted. Our southward progress halted at 84.799°N at midnight, and we were bumped north to 84.804°N at 6:00 Am, and then sagged back to 84.799°N at noon. Our westward progress halted at 12.109°E at 3:00 AM, we were jostled back to 12.195°E at 9:00 AM, and then nudged west to 12.181°E at noon. With all these shifts occurring you can understand the floes do a lot of crashing and smashing, and see why our camera may have been crushed by a pressure ridge. There is nothing neat and tidy about the Arctic Ocean this year, and one adventurer described the situation as “crazy ice.”
NEW CAMERAS
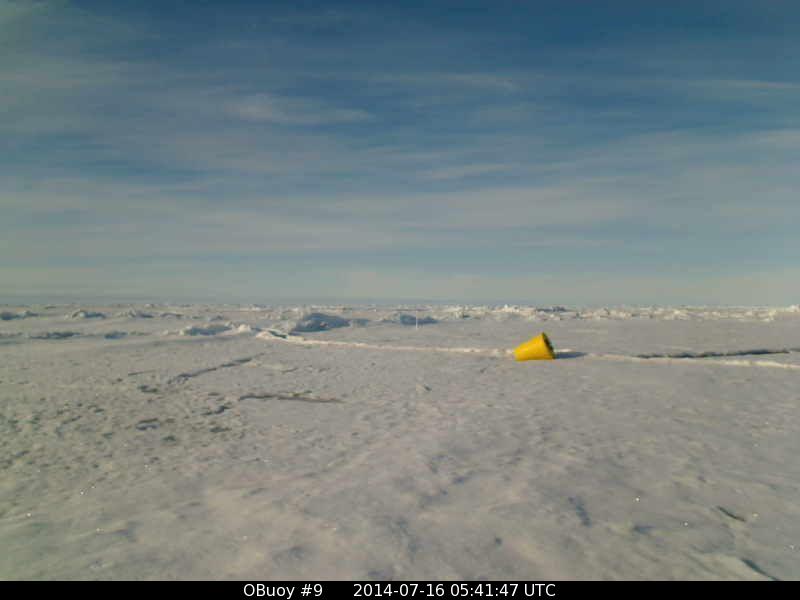
Originally these pictures merely supplimented the Noth Pole Camera, but now they are my fix of cool pictures in hot summer weather. They are from the “O-buoy Project.” The first is Camera Nine, which has drifted from over towards Bering Strait, and is now passing quite near the Pole on the Canadian side, at 88 north latitude. Originally the camera looked over completely flat ice, but the stresses of the winter built the small pressure ridges. I expect melt-water pools to be appearing soon.
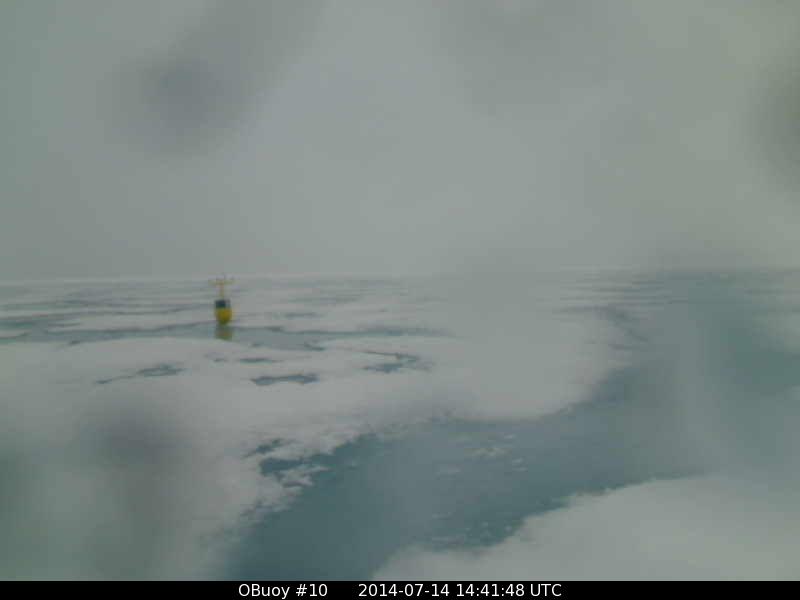
The second picture is from Camera Ten, which is much further south, a little south of 77 degrees latitude, north of Alaska. As best I can tell, the ice is nine feet thick, but as you can see the summer thaw is in progress.

This series of posts will be continued at: https://sunriseswansong.wordpress.com/2014/07/16/arctic-sea-ice-melt-flat-lining-death-spiral/

Happy Independence Day to you and to all our American Cousins.
Thanks, David. I had a lovely weekend, but Alas, now it is Monday.
A last clip from the smushed camera to better show the tilting at the end: http://cdn.makeagif.com/media/7-05-2014/Kin74G.gif
Thank you very much! I’ll paste this link in my post, (giving you credit, of course.)
The backwards flow is unusual, I’ve watched ice moving around for several years now, the mix of the reduced pacific heat flux with the atlantic playing coy made an interesting little mixup which seems to be rather handily screwing up all of the doom and gloom up north.
Greenland’s icecap breeds high pressure, especially during the winter, and the North Atlantic breeds storms, especially during the winter, and the the flow on the east side of the high and the west side of the storms makes the flow in Fram Strait usually north. Last winter it was so strong the ice kept right on moving south even when it was twenty below, and you’d think things would freeze fast. However winds get much lighter in the summer, and once you get north of Fram Strait they can wander all over the place. Last summer the camera crossed 84 degrees latitude twelve times, before heading south for good. (The weather buoy wound up on the north coast of Iceland.)
The only thing that could possibly reduce this summer’s ice cover to record levels, at this late date, would be a tremendous flushing of ice south through Fram Strait, as happened after Tamboro Volcano blew in 1815. I very much doubt we’ll see that, and the question in my mind is whether the ice levels can get back to 2002 levels. That might get some Alarmists to renounce their faith.
Hallo,
I think it is just a simple vortex in the ocean. Last year “webcam 2” moved also around in circles. I think to have seen an animation of these circles high in the north but I cannot find the clip again. It was one of the animations as explained here: http://www.jpl.nasa.gov/news/news.php?release=2012-099 .
What we need is a period of calm, so we can see how the ice moves without wind. It does seem to be very responsive to the wind, as the GPS shows the ice will change direction immediately, when the wind does.