THAW SPEAKS WITH FORKED TONGUE

This is just an observation, because sometimes even a simpleton’s observation can trigger entire chains of thought in better minds.

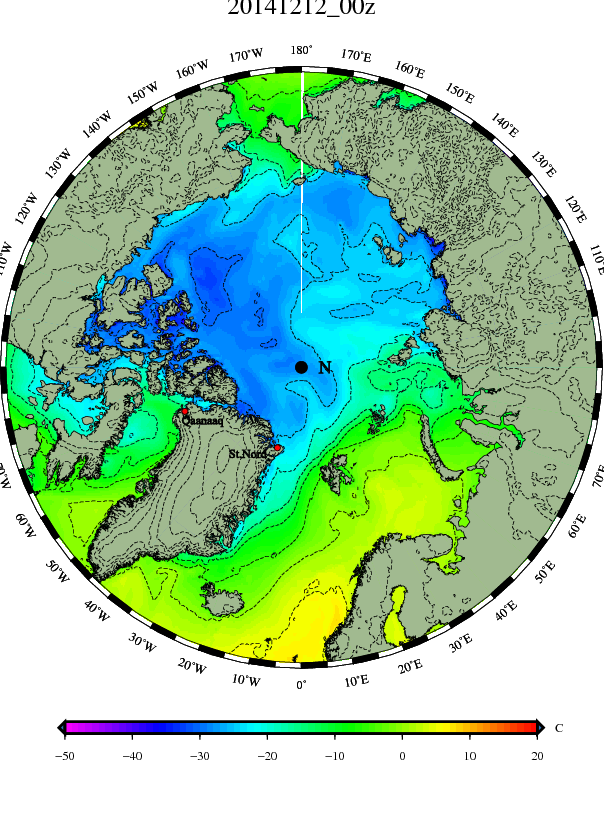
Europe’s weather has almost no effect on weather here in New Hampshire, as Europe is “down stream.” My interest is mostly in how Europe’s weather is effecting the weather north of Scandinavia in Barents Sea, due to my hobby of studying sea-ice. However I did live in Scotland for nearly a year, so perhaps I have a few fond memories that increase my interest, and cause me to focus more than I would if I were sensible.

One thing I’ve focused on is how our warm air masses head across the Atlantic, sometimes fueling huge gales and hardship, and sometimes arriving in Europe as benign  northern arms of the Azores high, begiling and enchanting northern lands with southern warmth.

Last winter North America was so cold much warmth was shunted off shore and headed north to aid Europe. It was like the good old days, when America could afford to be generous.  Europe hardly had a winter, so much mildness poured over it on southwest winds.  Now, however, perhaps America is bankrupt and shrunken, for even when we send our warmth northeast, it seems pirates rob the freighters of air before they get to  Europe.  Our promises are reduced to those made with a forked tongue.

I became aware of this keenly, quite recently, after I had decided the past cold spell had ended in Europe, and England was being rescued by warm west winds, but then read a blogger describe how the west winds held snow, at a rate of an inch an hour.  This was so utterly different from last year I sought a cause.

Of course, I can’t describe the cause in terms a scientist would think much of. However, as a layman, I can state there certainly is a thing-in-the-way. Something is causing the nice, mild flow of air we send to Europe to fork like a snake’s tongue. Where it flooded straight ahead last year, this year it either turns left towards the top of Greenland, or turns right to head through the Mediterranean, or, if plows straight ahead, gets occluded, in which case the warm air is to high up to do those on the ground much good.

Last year I described Siberian air as “the snout of Igor”.  This year it as if that snout has kept nosing west, then flinching back, but then nosing further west, before flinching back not-as-far.  It is a repetitive, progressively westward sort of snouting. It doesn’t take a nice, neat form, as a high pressure, though sometimes it builds a high pressure. Rather it is just a cold, sinister, east wind.

I’ll leave it to larger minds to fathom it all, and to study the differences between last year and this year, and explain it to fools like myself. I’ll just give you a series of UK Met maps,showing how the nice warm air we send to Sweden never gets there.

The first map shows that, while our last warm package may have been thwarted short of the coast of Norway, southeast of Iceland we have a total of four warm fronts, headed straight for Sweden to impress those Swedish babes. (Click maps to enlarge.)

UKMet 0106A 21404681

24 hours later we’ve only impressed the babes of Ireland.

UK Met 0106B 21406920

48 hours later we may be impressing the babes in Paris, but what the heck happened in Sweden? No sooner did we get there when a cold front boots us out! What kind of welcome is that. (Also note the sourse region for the west winds is not the Azores. It is the southern tip of Greenland. It may not be Siberian air, but it isn’t summery.)

At least we can look west. and see two more lows crossing the Atlantic, bringing reinforcements of mild air.

UK Met 0106C 21407544

After 72 hours we are wondering  “What the heck is going on?” The warm air that wooed Paris is now a shrunken warm sector by the Black Sea, and all the warmth of our first reinforcement is occluded aloft as it approaches Norway. (Please remember last year warm fronts surged right over Scandinavia with little trouble.) However at least we have our second reinforcement approaching Ireland.

UK Met 0106D 21408521

After 96 hours we are definitely discouraged. Though we did manage to again get a warm front into Paris, the Swedes are laughing at us, as we never get there. Furthermore, winds are turning north in the north of Sweden. Our rivals the Russians are coming!

UK Met 0106E 21411673

By 120 hours all our attempts to warm Europe are a shambles. A fragment of a warm sector is over the Black Sea, but all other warmth has been occluded and is aloft. The Atlantic air over Europe is not from the Azores, but from Baffin Bay and Greenland. And Siberian air is starting to swoop around the  north side of the low east of Finland.

How did that low get there, anyway? Last year lows charged up over Scandinavia and continued on, at least in part, along the Siberian coast, east all the way to the Bering Strait. This year they have no identity, and form and reform into a ill-defined shape that sags southeast, and allows Siberian cold to come west over the north side.

UK Met 0106F 21411683

Last year the maps always seemed to show southwest winds over Scandinavia. This years map shows winds swinging to the northeast.  An invisible shape is forking what was a straight flow.

That is my observation. You figure out the details.


CROSS POLAR FLOW —OR, HOW TO MESS UP COMPUTER MODELS—

I am very ignorant concerning computers, and I only mention this as a ignorant soul telling a Rembrandt his shoelace is untied.

The models amaze me with their accuracy five days into the future, most of the time. I have a hard time forecasting tomorrow. Therefore I rely on models, and notice when they are not amazing, five days into the future. Recently they have been spectacularly wrong, especially as you get up into northern latitudes.

I’ve been wondering if they think in a circular manner. They might see weather patterns going around and around the earth.  It might throw a wrench in the works, and be over-the-top, so to speak, when rather than around and around, cross-polar-flow brings things over the top.

The recent cold that clobbered Europe was unseen by models, even three days ahead of time. I think it may be because the models are based on a nice, “zonal” flow, and have trouble when the Pole is afflicted by what some (me) call a “loopy” flow, and others call “meridianal.”

The best model at handling such cross-polar-flow seems to be the Canadian “JEM” model, likely because Canada gets clobbered by cross-polar-flow more than most other nations. Perhaps the JEM model does not do as well with round-and-round the earth patterns, for it is not the best model overall, however when it does score a “coup” it seems it is because it added over-the-top cold to the mix. (Of course, the JEM model has a habit of creating over-the-normal super-storms, but no one is perfect.)

I thought it might be interesting to see what the JEM model produced, and what follows gives you an idea of the wrenches the Pole can throw into the works of any model that accepts a zonal flow as a basic premise.

(These maps are produced by a Rembrandt of the weather-map-world called Dr. Ryan Maue, of the Weatherbell site, however these maps are blemished by a bit of digital graffiti down the left sides. Likely Dr. Maue was operating on two hours of sleep when he wrote the code for this map, or perhaps the Canadian computers produced the glitch and the graffiti  is beyond Dr. Maue’s control. In any case, it is an untied shoelace, and I hope you will ignore it and enjoy the great art.)

All these maps can be clicked, or opened to a new tab, to enlarge them. Then they can be clicked a second time to enlarge them further.

The first, “initial” map shows a Pacific invasion has nearly reached the Pole, but a tremendously cold airmass in Siberia, (the hottest pink is -70°), is rushing north behind the invasion, cutting it off. (The clash between the the milder and frigid air is creating a decent polar storm.) This northward rush of Siberian air is what I called “the snout of Igor” last year, and makes me worry, though I am off the map and on the far side of the planet.

CPF1 cmc_t2m_arctic_1

The next map shows that a day later the Siberian air has charged right across the Pole. The Pacific invasion is cut off, but an Atlantic invasion is starting north west of Norway. (Notice the cold air has been driven from northern Scandinavia.) Things look bad for Canada, with that thrust of Siberian air charging their way.

CPF2 cmc_t2m_arctic_5

The next map, 48 hours later, makes one say, “But what is this?” A new invasion of Pacific air is attacking the cross-polar-flow from one side, as the Atlantic invasion proceeds from the other. Will the flow be strangled?

CPF3 cmc_t2m_arctic_9

After 72 hours the Pacific invasion seems to be overpowering the Atlantic invasion, and rather than the cross-polar-flow being nipped in the bud, it is developing a curve, or a sort of saddle. Warmth has pushed east of Finland into Russia.

CPF4 cmc_t2m_arctic_13

After 96 hours the curve in the cross-polar flow has become such an oxbow that the air is starting to aim not towards Canada initially, but west towards Scandinavia. Notice that west of Finland, the cold is no longer retreating east in Russia, but starting to advance west.

(I think this is where some models start to lose it.)

CPF5 cmc_t2m_arctic_17

After 120 hours the original cross-polar-flow has collapsed into a surge of cold back towards Scandinavia. However a new cross-polar-flow is starting, and the most-recent Pacific invasion is again being cut off. Northern Scandinavia is much colder.

CPF6 cmc_t2m_arctic_21

Lastly at 144 hours, (which is starting to enter la-la land, for models), we see some bizarre feature north of Greenland throwing mild air up towards the Pole.  (“I’ll believe it when I see it.”)  However what seems a little more reliable is, first of all,  that the new cross-polar-flow has hooked up with Canada, and the air in northern Canada is nearly as cold as Siberia’s.  Secondly, the old cross-polar-flow has sent really cold air crashing into Scandinavia.

(It is sort of like the cross-polar-flow was a meandering river, and cut off an oxbow, but in the atmosphere an oxbow does not just sit stagnant, as an oxbow lake, but is a mobile thing, as Scandinavia may see first hand, 144 hours from the time of the first map.)

CPF7 cmc_t2m_arctic_25

Please remember all of the above is occurring in the virtual world of computer models. It is theory, not reality.  However what is so fascinating to me is how different weather patterns look, when you view the globe from the top, rather than always from one side or another.

SNOW IN ALGERIA (with update)(Winter of 2014-2015)

Algeria Snow 2210_algeria

I am always interested in snow and cold getting across the warm Mediterranean to North Africa, as my over-active imagination likes to create a blooming Sahara.

This is the second time in two years they’ve had the rare snows down there. I haven’t heard whether it snowed on the pyramids again, (which resulted in a wonderful hoax and Photoshopped picture, last year.)

Apparently there were reports of snowflakes in the air on the island of Malta, right out in the Mediterranean, which would have been a first. The Malta weather bureau couldn’t confirm it.

http://www.maltatoday.com.mt/news/world/47963/snow_blankets_sicily_and_northern_africa#.VKmin9LF_kc

This first Siberian blast is pretty much over.  The high pressure which had freezing east winds to its south side had milder west winds bringing Atlantic air east on its north side, and for a while it was warmer in Sweden than in Sicily.  Some good reports are in this post from Watts Up With That:

Snow in Palermo, Sicily

Here’s a brief video of snow in Palermo. For some reason pictures from this video which appeared around the web have vanished. Likely it is some copyright fuss.

http://www.euronews.com/2014/12/31/blanket-of-snow-and-icy-conditions-across-italy-for-new-year/

Even up in Scandinavia, where the milder Atlantic air came in from the west, it was cold enough to cause so much snow they had to plow the slopes to keep skiers from getting caught up in the workings of the lifts and ground into hamburger.

Norway ski plowing utviken_sn%C3%B8

http://www.firda.no/Dette_skisenteret_m__fjerne_sn_-5-15-15714.html

The mild air over Scandinavia brewed up a sizable gale up there, but now that gale is sliding east, and absorbing a lesser storm to its west, and it looks like that, behind the two storms, a northerly flow will come down over Europe tomorrow. What is interesting is that it is almost immediately followed by a southerly flow as the next Atlantic storm moves in from the west.

UK Met 0104A 21358040 UK Met 0104B 21360686 UK Met 0104C 21360964

These back and forth surges of air have been interesting to watch. The computer models can’t seem to handle them very well beyond a few days into the future, for some reason.

What I am  watching to see is if a pattern repeats. If it repeats the mild air will surge up towards the Pole, but then low pressure will collapse down into Siberia, and the north side of that low pressure will bring a new wave of Siberian air west into Europe. However that is a big “if.”

UPDATE —January 6—

Even as milder air has surged up towards northern Norway, and milder Atlantic air has brought above freezing temperatures nearly to the towns in 24-hour-darkness upon Svalbard, what is left of the last European Cold-wave has sagged south and now is bringing snow-warnings to the Holy Land, as Joe Bastardi noted on his blog at Weatherbell today:

Holy Land Snow Screen_Shot_2015_01_06_at_8_10_04_AM

If it does get above freezing in Svalbard, it will be warmer there, well north of the Arctic Circle,  than where Arabs ride camels under date palms.  That just shows you how amazingly topsy-turvy and loopy a “meridianal flow” can get, in Europe and western Asia.

By the way, before babes in Sweden send their muffs and mittens to Palestine, it should be noted that the Canadian model is showing another Siberian invasion hitting Scandinavia in around six days. (See my January 6 post on cross-polar-flow for more details.)


LOCAL VIEW —Brunt Bearing—

The Christmas break is about over, in terms of brutal weather. You can tell the north is up to no good when the isobars are straight north-south all the way from high pressure in the  the Canadian Rockies to low pressure east of Greenland.

20141229 satsfc

When these surges of cold come south you look for a storm to brew up, but the storm south of us looks like it is being swept right out to sea before the cold air can catch up to it, and turn it into a blizzard. There is too much of a gap between the first cool front, with polar air behind it, and the second that indicates the arrival of the truly arctic air.

20141229 rad_nat_640x480

It would be fine with me if all the storms stayed south of here, and we just saw the lakes freeze up and make for good skating.  The ski areas wouldn’t be happy, but maybe we could arrange for some flurries in the higher hills.

The problem is that, during some of these 1970’s-style winters, the arrival of the cold brings about huge surges of warm air back north. The winter of 1977-1978 springs to mind, with three blizzards, two in the east and one in Ohio. (Check out the end of the December 17 post for details of those storms.) https://sunriseswansong.wordpress.com/2014/12/17/local-view-to-snow-or-no/

Currently it looks like the surge of the warmth will occur across the Atlantic. As a cold high pressure settles down and brings a winter cold front as far south as north Africa, with cold, east winds on the south side of the high pressure, a rebound of milder air will rush up around the top of the high pressure, and the UK Met is showing a New Year’s Day where it might be milder in Sweden than in Sicily.  (We’ll see about that.)

20141229 21210834

I’m not sure why I’m looking at Europe. I should pay attention to what is in front of my nose, which is a opportunity created by an open winter. The last of the Thanksgiving snowstorm has melted away, and the forest floor has gone from white snows to being leafy and brown.

I could use a spell with the woods staying snow-free, to get a bit of firewood out. We’ve used up more than I planned on, with the kids home and a baby in the house. Also I don’t need the work of snow-removal, for I’m feeling in the mood to write outside of this blog, and it is making me restless. If I disappear it will be because I’ve taken a time machine back to the early 1970’s, as that is what I want to write about.

Cabin fever, though the woods are snowless.
Cabin fever, though the days are fair.
Cabin fever, and it shows I grow less
Wise with time. Age makes me unaware.
 
Now my cabin is my flinching body,
That cringes from invigorating gales,
But my spirit still is hip, wild and gaudy
And longs to grip ropes and set winter sails.
 
“Let me out of here!” My restless spirit
Paces past eye-windows of discontent.
My songs creak and quaver, and I can hear it
And hush, and wonder where a lifetime went.
 
“What’s the point?” The answer is grim and clear.
Beethoven wrote best when he couldn’t hear.

ARCTIC SEA-ICE RECOVERY –Sneak Attack onto Europe–

The last two weeks has been interesting to watch, though the growth and extent of the ice is fairly normal. Here are the extent maps from December 12 (to the left) and December 27 (to the right).

DMI2 1212 arcticicennowcastDMI2 1227B arcticicennowcast

As Hudson Bay and the Bering Strait have frozen up, most of the growth in ice from now on has little to do with the Arctic. You could almost call it cosmetic. It will be occurring in the Pacific, or the mouth of the Saint Lawrence River, or the Baltic Sea, and therefore will be fleeting, and have little to do with the Arctic Sea itself, which is what all the fuss is about in the summer.

I tend to watch the arctic ice-thickness maps, which can give you an idea where the ice is moving. It moves far more than many imagine. For example, hundreds of square miles of thicker ice that had been lodged north of Franz Josef Land was shifted west by storms and crashed into the north coast of Svalbard, over the past month. This created a sort of polynya of open water where the ice had been by Franz Josef Land, which swiftly froze over and became thin ice.

DMI2 1227B arcticictnowcast

If this large body of ice continued to move west it might be flushed south through Fram Strait, which could create a situation much like occurred in 2007, when the thick ice was flushed south of the Pole, leaving the Pole with a thin skim of ice as summer approached, and, because the thin ice melted easily, the people who assume the icecap is in a “Death Spiral” had something to hype. (The main difference between now and 2007 is that there is much more thick ice north of Canada now.)

Watching the thickness maps allows you to see where the ice is piling up and where it is thinning, and gives you a rough idea on the total volume of ice up there.  There are many interesting processes occurring that you seldom read about.  For example, the same strong winds that blew the ice away from Franz Josef Land also blew the ice away from the south coast of the Kara Sea, and you can see that ice as thin blue lines of thicker ice now out in the middle of the Kara Sea.

Ice really piles up on the west coast of Baffin Bay, and grinds southeast along that coast and then along the coast of Labrador towards the North Atlantic. Ice also can pile up on the south and east coast of Hudson Bay, while the north coast can see polnyas form, so that even though the north was the first to freeze and the south was the last to freeze, by spring the south has thicker ice than the north. Lastly, ice can be seen piling up just west of the Bering Strait on the north coast of Russia; last year this ice was piled up 20 feet thick there by spring.

Watching the thickness maps brings many surprises, especially when storms wrack the ice. In the dead of winter, with temperatures at -40°, I have seen leads of open water form that are scores of miles across and hundreds of miles across. The open water freezes to thin ice almost immediately, but sometimes you can still see signs of that thinner ice months later. In a similar manner storms had a lot to do with the build up of thicker ice north of Canada.

At times the thick ice can crumble and be spread out into open waters, and mess up all sorts of neat calculations in the process. Where a cold current often sinks when it meets a warmer current, and more saline waters want to sink beneath more brackish waters, it is physically impossible for the ice to sink, and it bobs merrily onwards on top, often significantly chilling both the temperatures of the surface waters and the air, until it melts away. Therefore a strong wind transporting ice south can alter temperature maps with startling speed.

I imagine there are times when such alterations make a difference in the forecasts generated by computer models. They may even explain why the models utterly failed to foresee the cold that slumped south onto Europe recently. Just as it only takes a single pebble to start an avalanche, a single miscalculation can mess up a computer model.

Although the models did not see the cold coming, Joseph D’Aleo and Joe Bastardi on their blogs at the Weatherbell site did say we should be on guard for cold waves to hit Europe, as the autumnal patterns were similar to years in the past that saw cold waves hit Europe. They didn’t explain how it was going to happen in a step-by-step way, so I watched very carefully to see if I could see the steps as they occurred.

Back on December 12 we were seeing south winds bring warm air flooding north over Scandinavia, as the Atlantic storms veered north towards the Pole. A lot of Barents Sea was above freezing. Cold air was exiting the Arctic down the east coast of Greenland.

DMI2 1212 mslp_latest.big DMI2 1212 temp_latest.big


This pattern continued on December 14

DMI2 1214 mslp_latest.big DMI2 1214 temp_latest.big


And peaked around December 17

DMI2 1217 mslp_latest.big DMI2 1217 temp_latest.big

By December 19 the storms were no longer heading up to the Pole, but were moving east along the north coast of Russia. Barents Sea was cooling down, and to the east of the storm cold Siberian air was drawn up over the Arctic Sea and then dragged back west, and the milder Atlantic air lost its influence over the Pole.

DMI2 1219 mslp_latest.big DMI2 1219B temp_latest.big


By December 21 the new storm track had the east winds to its north starting to drag cold air back towards Scandinavia. The following Atlantic Gale didn’t bring such a flood of warmth north.

DMI2 1221B mslp_latest.big DMI2 1221B temp_latest.big


By December 24 the new storm track had penetrated weakly to the Pacific side of the Pole, and chilled Pacific air was being drawn over the Pole, but was too cold to warm the Pole much, and the cold air over the Pole was heading south to Scandinavia, and below freezing temperatures seeped down the coast of Norway.

DMI2 1224B mslp_latest.big DMI2 1224B temp_latest.big


By the 26th of December the cold was building over the Pole, and the strongest low pressure was east of Scandinavia, transporting Siberian air back west over its top towards a Barents Sea that was now far colder, especially to its north. The Pole was as cold as it ever gets, except on rare occasions, and the weight of that dense air was spreading out, including down towards Europe.

DMI2 1226B mslp_latest.big DMI2 1226B temp_latest.big


Today we see the following North Atlantic low is weak, without a surge of southerly winds, and the isobars hint of a discharge straight from the Pole to Scandinavia and areas further south.

DMI2 1227 mslp_latest.big DMI2 1227 temp_latest.big

This afternoon’s map shows the weak low bringing snow to Britain and the cold continuing to press south over Europe.

DMI2 1227B mslp_latest.big DMI2 1227B temp_latest.big

The computer models didn’t see this cold coming, even a few days ago, but now much of western Europe is below normal. As this cold continues to press south it is likely create elongated high pressure west to east. There may be a warm-up over Scandinavia as winds turn west to the north of the high pressure, but east winds to the south of the cold high pressure will bring very cold Siberian air further and further towards the Mediterranean, and a southern storm track will bring snows to Italy and perhaps even the north coast of Africa, before the cold is moderated.

DMI2 1227B gfs_t2m_anom_eur_1


However I have no business talking about Africa in a post about the Arctic, so I’ll just show the graph of temperatures north of 80 degrees latitude, which informs us the arctic is loaded with midwinter cold, and has plenty to spare.

DMI2 1227B meanT_2014

Besides dumping cold down on Europe, some is being dumped south into Canada and the western USA.  The thing to remember is that not only the Pole creates cold, but all areas of Tundra and Taiga generate cold as well, during these shortest of days. Better look for where you left your mittens.

DMI2 1227B gfs_t2m_noram_1

(These maps are created by Dr. Ryan Maue at the Weatherbell site.)