ARCTIC SEA-ICE –Yet Another Blip–

Another blip has appeared on the DMI “extent” graph.

Upticks in “extent” such as this in August do not indicate any new sea-ice has formed. (As can be seen by referring to “volume” graphs.) Rather it tends to indicate sea-ice has spread out. “Extent” measures sea-ice without specifying how concentrated it is; a square km is a square km, whether the concentration is 100% or 15%. Usually sea-ice of concentrations less than 15% are defined as “open water” even if the concentration is 14%. Therefore it can be seen that, should winds push ice into open water, there can be an uptick in “extent” as the concentrated sea-ice is dispersed. I think the current uptick is due to north winds pushing sea-ice into the ice-free Laptev Sea.

As the shallow waters of the Laptev Sea have been warmed by the summer sun, the sea-ice shifted into those waters should swiftly melt as the waters are cooled. Those waters are five degrees above normal, according to the NOAA sea Surface Temperature Anomaly map.

I have a bit of a problem with the modeling NOAA uses, for at the center of the above map you will notice the deep, nearly-brown red actually touches the sea-ice. This is actually a physical impossibility, for the temperature of ice water, by definition, is the freezing point of that water, depending on how much salt it contains. For ice-water to be five degrees above normal means “normal” is water five degrees below freezing, which would be ice. See the problem?

What the edge of the ice should look like is how the south of Hudson Bay looks, as the last bits of ice melt away. Until the ice is gone the water, by definition, must be at freezing. The Canadian ice service shows ice remains, though it is melting fast.

And here the NOAA SST anomally map does show waters right at freezing, (or just below, as salt-water freezes at colder temperatures.)

Another place where the model’s output is questionable is along the coast of Newfoundland, where the sea-ice has retreated north but the icebergs still come south. Here is a good picture to demonstrate the difference between sea-ice and icebergs:

Sea-ice tends to be one to as much as nine feet thick, but icebergs can be gigantic, hundreds of feet thick.

Though the sea-ice has melted north, the icebergs are still coming south.

The icebergs do not show up on “extent” maps because they represent less than 15% (or even 1%) of the surface, but there are many of them even in the summer. To avoid a repeat of the Titanic, the movement of these icebergs must be tracked and charted.

Greenland must shed these huge bergs because more snow falls on its icecap than summer can melt. In fact, the past two summers melted even less snow than normal.

2020-2021 melt. (brown line)
2021-2022 melt (so far)

The above graph measures in gigatons, which is a colossal unit of measurement. A gigaton is 2.2 trillion pounds of water. (2,200,000,000). If you want to alarm people just mention that on a warm summer day the edges of Greenland shed 8.8 trillion pounds of water. Yet that is only a drop compared to what it loses in an entire summer, and in a summer only a third of what falls as snow is able to be melted (except on an exceptional year like 2011-2012.) What becomes of the other two thirds? It flows off Greenland as glaciers.

The size of these glaciers boggles the mind. When some of the icebergs break off the icecap at the edge, the land literally springs upwards, relieved of the weight. Earthquakes range as high as 5.0 on the Richter Scale, and can be seen on seismographs on the far side of the planet. Every summer roughly 4,400 trillion pounds of ice must be shed by Greenland just to achieve a balance, and all this ice comes floating south, down the east coast of Greenland and west coast of Baffin Bay. Each berg, and especially the larger icebergs, has a mini ecosystem all its own surrounding it. Sailors describe how they each have a cooler pocket of air around them and sometimes their own fogs, and each creates its own freshwater lens atop the saltier sea. With “sails” extending up over a hundred feet and “keels” down nine hundred, they can gouge coastal sea-bottoms and move contrary to currents, and stir the water like gigantic spoons, and when the bottoms melt more swiftly than the tops they can capsize with tremendous churning and splashing. Remembering that we are talking about 4,400 trillion pounds, just imagine the mess their magnitude, independence and variability makes of any attempts to model sea-surface temperatures along the northern edge of the Gulf Stream! Largely I think it best to use present tense satellite data and not attempt to chart the complexity, though the mortal mind loves to wonder about such things.

Yet all this is going on unseen by NOAA SST anomaly maps. Not that I don’t value the maps, and refer to them constantly, but I recognize their limits.

One final thing I notice in the maps is that it is colder than normal up in Bering Strait.

This anomaly in Being Strait likely is due to the cold PDO and La Nina, and may be indicative of colder than normal water flowing into the Arctic Sea, which could, (I hypothesize), preserve sea-ice blown into open water, or at least slow its melt. Where I usually regard blips in the “extent” graph in August with skepticism over their ability to predict any true increase in “extent” levels, and indeed think they often indicate a mass of ice will be melted more quickly because it is shifted into warmer waters, I am not so sure of myself this year, and am keeping one eyebrow quirked.

Stay tuned.

ARCTIC SEA-ICE –Hudson Bay Freezes–

Hudson Bay is a relatively landlocked extension of the Atlantic Ocean in northeastern Canada of considerable size. It amounts to nearly a half million square miles, and has a definite influence on surrounding land masses, having a “maritime influence” when it is unfrozen, and a chilling influence when it is ice-covered. I am sensitive to this difference because autumnal gales often park over Labrador, wheeling winds over Hudson Bay and then down to where I live in New Hampshire. Our first arctic blasts cross over Hudson’s Bay’s waters, and while the waters are open the winds are warmed quite dramatically. Through the wonders of satellite technology, the air temperatures can be mapped, and it can be seen how air as cold as minus forty is warmed to freezing by the passage over liquid water. However as soon as Hudson Bay becomes ice-covered the air is not warmed so dramatically, and in fact once the ice thickens to several feet thick air can even chill over the bay, due to radiational cooling during long, starry nights. In essence Hudson Bay turns from an angel to a devil, in terms of New Hampshire, as its winds turn from being gentled to being bitterly cold.

The change can occur as early as November, but usually occurs in early December. It always amazes me how swiftly a half million square miles of open water turns to an ice-covered sea. This year it was a little late (and I am a bit surprised no Alarmists noticed the lateness, nor produced sensationalist headlines about how the lateness proved the world was warming, and we are all doomed.) Susan Crockford announced polar bears were moving out onto the new ice on November 26, and that this was 3 1/2 weeks later than 2020, when Hudson Bay was more than half frozen over by November 26.

Sea ice cometh to Hudson Bay: freeze-up has begun

One thing I try to adhere to is the avoidance of “cherry picking” while observing the sea ice. There is always variety, and it becomes silly if you only pick the places which support your view (less ice, if you are Alarmist, and less open water, if you are Skeptic.) Susan pointed out a perfect example of this in a prior post, where she compared the years 2020 and 2021, on November 23. Here is 2020:

And here is 2021:

Now, if you are an Alarmist, you can point out how much less sea-ice there is in Huson Bay in 2021 than in 2020, but if you are a Skeptic you counter by pointing out how much more sea-ice there is north and south of Bering Strait (or east of Svalbard.) All in all, it matters little, unless you live in New Hampshire and hope Hudson Bay stays open and continues to moderate the arctic blasts from the north.

At first the ice tends to form a skim at the very edges, especially on the west side where offshore winds are most bitterly cold. This thin ice tends to be piled up along the shoreline when winds swing around and become onshore. This year the growth was very slow until around December 3:

This “shorefast” ice cannot extend very far out to sea as long as the water temperatures are above freezing, and a sunny summer had the waters of Hudson Bay especially warm (the summer storm track was dented south.) However the onset of very long nights and very short days, with shallow sunshine, swiftly chills the waters, until a sort of flash freeze occurs, and the entire Bay ices over in roughly 14-21 days. Here is the ice cover on Christmas:

The darker lilac hues represent ice more than a foot thick, and the dark patch in the center of Hudson Bay is a bit of a mystery to me. Usually, the thicker ice is shorefast ice which was pushed away from shore (for example, in northwest Hudson Bay,) but this thicker sea-ice was home grown. More mysterious is that it lies in the same area which resisted freezing longest, open water which even paused the expansion of sea-ice for several days, roughly ten days ago. I assume the resistance allowed the ice to be piled up more, as waves had more time to do their stuff. But that is only a guess. (This is just an example of how, if you keep your eyes open, and don’t close your mind with preconceptions, the daily doings of the sea-ice can be filled with wonders to wonder about.)

One thing I like to wonder about is the astounding amount of heat released by these flash freezes. After all, what is the difference between water at thirty-two degrees and ice at thirty-two degrees? The difference is that the water molecule holds heat, as latent heat, and in order to freeze that molecule into a crystal that heat must be removed. When you are watching a half million square miles freeze in 21 days you are seeing latent heat released at a rate of roughly a thousand square miles an hour. Don’t ask me for a number in terms of calories, but it has got to be a lot, and is a last gasp of warming for New Hampshire. There is no noticable uptick in temperatures, except for the winds sweeping south across Hudson Bay. And then?

And then the tundra, (which truly isn’t barren), most deserves to be called “the barrens”, because it sucks the heat of life up at an amazing rate, especially north of the arctic circle where the sun never shines. You can witness the fierce chilling by tracking a milder mass of Atlantic or Pacific air when it has the misfortune to be drawn north into the deep freeze. The airmass chills swiftly, at a rate of five to ten degrees a day (depending on cloud cover), until, within a week, you can’t differentiate it from the deep blue air of the Pole on the isotherm maps, (deep blue meaning the air is down near thirty to forty below.)

Once Hudson Bay is frozen there are no truly enclosed areas of water left to freeze, and all further increases in sea-ice occurs along battlelines between ice and water, between the frozen Arctic Sea and the open Atlantic, or between the open Pacific and ice attempting to extend south from Being Strait and east from the east coast of Siberia into the Sea of Oshkosh. In such battles the ice sometimes advances miles when the winds are north, and then retreats miles as winds swing around and ice is crushed. For this reason the “extent” graph is slower to rise, and in fact there even seems to be a pause in the “extent” graph, every year, marking when the freeze of Hudson Bay is complete.

This year the increase in extent shows a slight slowdown as Hudson Bay completes its freeze, but otherwise continues to merrily rise and stay ahead of prior years. Not that “extent’ truly means all that much at this time of year. For example, one only needs to look at the 2020 line in the above graph, (yellow-green), and one can see 2020 had the highest extent of the past six years, in March, yet by early September it was lowest.

The problem with “extent” this time of year is that it involves the aforementioned battlelines between open sea and the arctic icepack, and this ice-edge depends greatly on weather patterns. Also, it battles over areas which will be open water as summer sets in. Although the “extent” will increase by more than two million km2 by March, it will all be along a southern periphery which the cold will retreat from, as warmer days arise. All the sea-ice in the Sea of Oshkosh will vanish, and even much of the ice in Hudson Bay will be gone.

The summer thawing of Hudson Bay is no new thing. After all, Henry Hudson “discovered” it by sailing it in the summer of 1609 (and the poor fellow was marooned there when his crew mutinied.) In the more than four centuries since, I can find a few summers when the Hudson Bay Company could not be resupplied, but that seemed to be because sea-ice clotted Hudson Strait to the north, and not the Bay itself. For the most part winter sea-ice is a “here today, gone tomorrow” proposition. Nearly two thirds of the sea-ice “extent” vanishes every year. So why do we bother with it?

Partly it is because, as I mentioned earlier, it seems to matter here in New Hampshire. We’ve had a relatively mild December, and I’ve been able to wear sneakers rather than boots, and I don’t think it is sheer coincidence that Hudson Bay was late to freeze. However now it has frozen, and I will not be at all surprised if it grows abruptly colder, and I don boots.

Also, the patterns that shift ice about do have an effect on the long-term growth and shrinkage of sea-ice in the arctic. Often the relationship between causes and effects are more complex than you would initially suspect. For example, temperatures up north of 80 degrees latitude have been colder this year than last year. Here is the graph for last year:

And here is the graph from this year:

Now, my initial response is to assume that though both years are above normal, (the green line represents normal), the past autumn got colder faster and remained colder overall, and with the blue line in the above graphs representing freezing, it can be seen the past autumn saw temperatures dip to thirty below freezing, (Celsius), and therefore there must have been more sea-ice created.

But at that point a voice in my head states, “Not so fast, Buckaroo.” There is another way to look at the above graphs. It is to add up the area between the green line and red line,and understand that also represents the amount of heat the arctic lost to outer space. And, in those terms, it can be seen that 2020 lost more heat than 2021 did.

There were two reasons. First 2020 began with far more open water, so the Arctic Sea itself lost more heat. Second, 2020 saw more intrusions of sub polar air, which means the sub polar regions lost more heat.

In the end I have to decide which year is more likely to increase sea-ice. With the authority vested unto me I declare I haven’t really got a clue. I simply watch, wonder, and wait.

A very good measure should be the “volume” of sea-ice, but, as I explained in an aggrieved manner last post, DMI “adjusted” its volume graph, and 2021 went from having the highest volume in recent years (and being above the gray line of “normal”) to being third highest. In any case, it is far above last year’s.

As I watch, wonder and wait, I look for situations which can result in an increase in volume, at least in the short term. Hopefully I’ll find time to delve more deeply into this subject in a future post. But, for the time being, I keenly watch to see if a lot of sea-ice is being flushed south through Fram Strait (which can have fascinating consequences I hope to address in a third post.) If this ice is not flushed south, it is retained, and simple logic states the volume of the sea-ice in the Central Arctic, (which is the ice that matters, after the edges melt away next summer), will increase.

One feature I am watching is a slender crescent of thicker ice north of Svalbard, about halfway between the Pole and Franz Josef Land:

If this feature heads towards the Pole (as occurred last winter) volume is more likely to increase than if it is flushed south through Fram Strait. And what is it doing? It is hithering and dithering, first moving one way and then the other. Today it was nudged towards the Pole by a flow up from the Kara Sea.

But tomorrow?

Stay tuned.

ARCTIC SEA ICE –The AMO Chill–

One of the most exasperating mistakes made by Alarmists is their refusal to study history. Instead they steadfastly insist all is caused by CO2. For example, history teaches us that summer is followed by winter, but, the next time winter comes around, so blinding is their bias that Alarmists will see the next winter as having a new and alarming cause all prior winters lacked. This time it will be caused by CO2. Not only do they insist they know the cause, but they then invent the cause-and-effect out of whole cloth.

Basically Alarmists follow the rule, “If you can’t blind them with brilliance, baffle them with bullshit.” When confronted by a plaintive voice that asks, “You said there would be Global Warming, so why is it colder?” they put on a white lab coat to look scientific, hold up an index finger, and basically say, “You can’t understand because you haven’t looked hard at the numbers, and haven’t seen they need to be adjusted, and our adjustments show that actually it is warmer”.  Or perhaps, “The increased heat causes more snow in the north, and the increased snow is floating south as bergs, so that the warmer it gets the colder it gets. Understood?” The problem with this ingenious excuse-making is that, when you look back in history, you can see the same thing happened in the past, which begs the question, “What caused it then, and is that cause happening again now?”

Once you study history you become aware of various cycles that influence the weather, (with much debate about how large and how regular the influences are).

Alarmists tend to pooh-pooh all other influences, calling them inconsequential, which seems rather odd, for at the same time they are saying a giant thing like the sun has no effect they are saying a very tiny change in the number of CO2 molecules, parts-per-million, has an enormous effect. Skeptics do not deny CO2 has an effect; the planet is indeed greener; but they question the denial of all other effects and cycles.

Things would be easier if we didn’t have a variable star, but our sun does have its cycles of sunspots. And things would also be easier if those sunspot cycles were neat and tidy, but they tend to be irregular, with the sun shifting from very active sunspot cycles to times when we see a “Quiet Sun”. The sun’s regularity likely creates oscillations in the world’s weather, even as the sun’s irregularity throws the same oscillations out of whack.

The current Quiet Sun seems to be messing with the oscillations between El Ninos and La Ninas, as the El Ninos seem stronger and the La Ninas weaker than expected. (Not that we are all that great at predicting them.) Also the Pacific oscillation (PDO) swung from warm to cold as expected, roughly a decade ago, but then unexpectedly spiked back to warm, and has been taking its sweet time getting back to cold, (though it may be trending that way this summer). Last but not least, the Atlantic oscillation (AMO) is not expected to turn cold for a few more years, but unexpectedly and dramatically shifted in that direction this summer.

The signature of a “cold” AMO is a backwards “C” of colder-than normal waters in the Atlantic. Recently the back of that “C” was broken by a blob of warmer-than-normal water that drifted east and pressed between England and France, but the rest of the “C” remains evident, repressing the development of hurricanes to a certain degree off western Africa, and most especially evident off the northeast coast of Canada and south of Greenland.

SST 20180712 anomnight.7.12.2018


The colder water off Canada and Greenland historically leads to colder weather in Northeast Canada, which they have seen this year, with snows even as we had a heatwave not far to their south, in New England. The ice has been much slower to melt out of Hudson Bay than last year.  (July 13, 2017 to left, July 13, 2018 to right)

It is a bit embarrassing to Alarmists to have this sea-ice sitting around in July, so they are likely busily inventing a theory from whole cloth even as I type. However all you need to do is study history to see the situation is not “Unprecedented”. A ship from Boston, early in Boston’s history, failed to get through the sea-ice into the bay in 1663, but the Nonsuch successfully entered the bay in 1668 and established the first Hudson Bay Trading Post at the mouth of Rupert River (the current town of Washaganish, Quebec.) So what does that give us; 370 years of history?

The trading posts had to be resupplied, and also furs needed to be onloaded, and we know the ships were not icebreakers. Therefore it is sheer foolishness to suggest the Bay was ice-bound in the past, and only recently has become ice-free. An early aerial picture of Fort York shows they were still using sailing ships as late as 1923.

Hudson Bay Company YorkFactoryaerial

However the historical record also shows there were occasional grim years when the posts could not be resupplied. If ice-bound years had been too common the enterprise would have become impractical, and perhaps traders would have starved. For the most part the Bay opened up in the summer; excessive sea-ice in July was the exception to the rule, and was likely caused by a cold AMO, just as we are seeing now.

In like manner, the chill is affecting Greenland. In July Greenland is experiencing the height of its melt, and usually gives Alarmists wonderful opportunities to take truly amazing pictures of  the yearly phenomenon. At the peak of the melt, Greenland loses roughly 4 gigatons of ice to melting every day.  Rivers of melt-water course across the surface of the ice.

Greenland melt 1 55-researchersd In places these torrents plunge down holes called moulins, forming spectacular waterfalls, and then continue on as subterranean rivers.

Greenland melt 2 hqdefaultIce also flows off Greenland as massive glaciers, and during the summer enormous slabs calve off the ends into the sea, with some bergs “half the size of Manhattan”.

Greenland melt 3 NINTCHDBPICT000419182729

And of course all this melting is fodder for Alarmists, and gives the media a chance to write thrillingly sensational stuff about ice melting and seas rising.

https://www.thesun.co.uk/news/6739060/greenland-iceberg-melting-video-climate-change/

However I think it’s wiser to not get too caught up in the hoopla, although it is fun, once in a while, to run around in circles waving your hands in a tizzy. It’s good exercise. But once you’re done it pays to calm down and catch your breath. And then ask a question or two. “How much ice usually melts? What is normal?”

The map to the right below shows the normal melt for July 14. You notice right away the melting is all at the edges. That is where all the photographs are taken for the newspapers. In the middle of Greenland the altitude is so high, (over 10,000 feet), that it almost never gets above freezing. Judging from the records of ice cores, only once in every 40 years does it get warm enough, on a windless summer day, to soften the snow a little. Not much; not enough to make rivulets or puddles, but enough to make a crust on the snow, when it refreezes, usually within hours. (When this last happened, in 2012 (I think) the media went completely berserk. They reported so inaccurately that you would have thought torrents, even mighty rivers, were coursing across the icecap. The actuality was that the snow softened for a couple hours. [yawn])

The map to the left shows what happened this year, on July 14. It set a record, but went unreported, for it was a record increase of snow, for the date.

Greenland MB 20180714 todaysmb

What happened was that, likely due the cold AMO, heavy snow punched inland in west-central Greenland, reducing the melt in that area at the same time snow was added. In fact more was added than was subtracted, which means that rather than the icecap losing 4 gigatons, as is normal, it actually gained a little. This shows as the spike in the upper graph below. Notice how the spike moves above the area shaded gray, which shows the historical range, and enters record-setting territory.

Greenland MB 20180714 accumulatedsmb

The lower graph shows, with the blue line, how Greenland’s icecap is failing to melt much this summer. Usually it loses roughly 200 gigatons, and this year it has lost 5, so far. This is a failure on the part of reality to support the Alarmist’s narrative. (Bad reality. Bad! Go to your room.)

Also notice, in the graph above, how, on an average year, (gray line), Greenland gains more than it loses. It ends the year with nearly 400 gigatons more than it started. (A gigaton is a billion metric tons, and a metric ton is 1000 kilograms.) How many Manhattans is that? In any case, for Greenland to stay in “balance” 400 extra gigatons worth of iceburgs must calve off Greenland’s glaciers.

Lastly notice the red line in the graph above. 2011-2012 was a winter and summer that pleased the Alarmists greatly, for it supported their narrative. Nearly all the winter’s increase melted away that summer. There was a gain, but it was small, only around 25 gigatons. It wouldn’t take many calving icebergs the size of Manhattan to arrive at a net loss. And how many gigatons would it take to rise the oceans a milometer?

I can’t do the math, but I did find this after searching the web a bit: “A one mm increase in sea-level requires about 3.618 × 10¹⁴ kg = 361.8 Gt of meltwater”.

In other words, while a billion metric tons might seem like a lot, it is a speck of dust, compared to the enormity of the icecap and the oceans. Greenland’s icecap is estimated to be a total of 2,850,000 cubic kilometers of ice. How many gigatons is that? (You do the math for me, please.)

Therefore even a “good” year (for Alarmists) like 2011-2012 really doesn’t amount to a hill of beans, but last year was a “bad” year. Greenland’s icecap actually gained ice, according to NOAA:

https://www.climate.gov/news-features/understanding-climate/greenland-ice-sheets-2017-weigh-suggests-small-increase-ice-mass

Of course, NOAA speaks of the gain as if it is an exception-to-the-rule, but still it is a failure on the part of Mother Nature to support the narrative. And what tactic does an Alarmist use, when something doesn’t support the narrative?

1.) Change the subject. Turn the camera to where the ice is still melting, to dramatic waterfalls pouring into turquoise moulins. Focus the lens on the spectacular sight of a giant berg calving off a towering glacier. Pay no attention to that man behind the curtain. Don’t look at the summer snowstorms in Labrador, and the summer trout fishing camps struggling to dig free of snow.

Fishing Lodge in June labrador-snow

The only problem is people can only be distracted and deflected so long, in which case it is time for…

2.) Invent a theory out of whole cloth. When people notice northern sandpipers can’t even lay their eggs because the snow hasn’t melted, figure out a way to blame the snow on warming. (Hat tip: Brett Keane)

https://www.scientificamerican.com/article/late-snowpack-signals-a-lost-summer-for-greenlands-shorebirds/

Sandpiper on snow 6450EF03-C77C-450D-8080621943C1804F

Here is the money-quote: “Senner fears this nonbreeding year in eastern Greenland could herald an alarming trend. Climate Models predict the Arctic atmosphere will hold more moisture as global temperatures rise, he notes. A wetter atmosphere means more snow in winter and spring, potentially causing late snowmelt to interfere with shorebird reproduction. He says the bird populations should be resilient to a single poor breeding year like 2018 but worries what might happen if this year’s catastrophe becomes standard. “Even though things aren’t normally as extreme as the current situation in Greenland,” he says, “this is the kind of thing that seems to be happening more and more frequently across the Arctic””

Balderdash. First, the increase in winter moisture is in air so cold that you are talking about the difference between air that is only very, very dry, rather than very, very, very dry. Second, the amount of snow that falls from that dry atmosphere is small, only inches, and tundra usually swiftly melts such snows under 24-hour or near-24-hour sunshine that can bring heatwaves to the north. Third, the snow is now falling in the summer. I repeat, the summer. Fourth, temperatures are colder over Greenland and eastern Canada because the AMO is cold, not because the planet is a tenth of a degree warmer overall. Fifth, it is also colder at the Pole itself.

DMI5 0715 meanT_2018

I’d like to help Alarmists out, but the simple fact polar temperatures remain so persistently below normal does suggest the Quiet Sun may be supplying less heat. The best I can do is to suggest it may be cloudier at the Pole, due to the low pressure I call “Ralph” reappearing and hanging about. Maybe we can concoct a theory out of whole cloth that explains Ralph is due to Global Warming, and that it is colder at the Pole because it is warmer. That would explain why the the sea-ice, despite having a head-start on other years last winter, is failing to melt as fast as other years.

DMI5 0715 osisaf_nh_iceextent_daily_5years_en

And it also might explain why the ice is thicker than last year, especially along the coasts of Alaska and East Siberia.  (2017 left; 2018 right)

But in the end there is little I can do for the poor Alarmists. It simply is a terrible year for them. All around there are signs of cooling, at least in the short term, but they must continue to genuflect to the emperor of funding, as if he wore clothes when it is increasingly obvious he is butt naked.

Stay tuned.

ARCTIC SEA-ICE –High Summer–

It is now the time of thawing at the Pole. The sun never sets, and instead rolls around and around, high enough above the horizon to nudge temperatures just above freezing. There are brief freezes, when the sun goes under a cloud or a downdraft brings cold sleet down from a summer shower, but for the most part non-stop thawing occurs, 24 hours a day, for around 1440 hours. This is no new thing; it has been occurring as long as men have wandered the Arctic Ocean. Back in the 1950’s and 1960’s and early 1970’s, men stationed on Fletcher’s Ice Island wore hip waders at times during the summer, the slush could get so deep.

Although we think of tabular icebergs as a feature of Antarctica, the Ward Hunt Ice Shelf, on the northern coast of Ellesmere Island in Canada’s high Arctic, produces them. A big berg from this shelf broke off, likely in the 1940’s, and was 50 m (160 ft) thick and covered an area of 90 sq km (35 sq mi). Between 1952 and 1978 it was used as a manned scientific research station that included huts, a power plant, and a runway for wheeled aircraft. Discovered by U.S. Air Force Colonel Joseph Fletcher, the iceberg was named T-3 or Fletcher’s Ice Island. It moved around the Arctic Ocean for many years, eventually exiting through the Fram Strait, between Greenland and Svalbard, and moved south and around the southern tip of Greenland to disintegrate and melt in Davis Strait. While it was inhabited in the high Arctic things grew so slushy in the summer the men could only be supplied by air drops, which meant they could receive mail, but never send any, for months. (No cell-phones, back then.)

The guys had to be tough and resourceful, as they awaited to things to freeze up in the fall. One year a large, shallow lake formed in the runway, and they tried to prepare the runway too soon, and a CAT broke through the ice. With things freezing up rapidly the men had to work furiously for 24 hours to get it out. The location of the berg that year was such that, “The first sunset was September 7th; the last sunrise was September 14th. So within a week, we went from total day to total night. Temperatures in September were often below 0°F, -17°C.”  With  the first flight not scheduled to land until November, but temperatures down to -35°F by late October, the generator quit. A hero named  Bill Hallett rebuilt it in a frantic rush, well aware there was no hope of outside help.

One interesting aside involves a time two women were sent north to work with the men. Apparently it was such a fiasco, in terms of multiple romances, jealousy and brawls, that it was never attempted again. So much for political correctness. But I digress. I’m suppose to be talking about a different sort of heat.

In the 1950’s a R4D (Navy version of the DC-3)  crashed on Fletcher’s ice island and, stripped of all valuable parts, became a sort of landmark that servicemen had their pictures taken with.

Fletcher's DC-3 1 kf3aa_p4

It is interesting how it looked years later:

Fletcher's DC-3 2 t-3-picture-r4d-on-pillar-apr-62-t3

This is not to suggest the Air Force puts itself on a pedestal, but rather that summer melting has always occurred at the Pole, for as long as we’ve been watching. And now we are watching it again.

DMI5 0619 meanT_2018

Sea-ice “extent”, “area”, and “volume”all tend to crash during the melt. The “extent” graph is being carefully watched, partly because it best supports the Alarmist narrative this year, and partly because some expect the melt to slow, once the thicker ice in the Central Arctic is reached.

DMI5 0619 osisaf_nh_iceextent_daily_5years_en

The DMI “volume” graph puzzled many, as the black line vanished. Apparently the computer program is designed in a manner where the gray line representing “normal” takes precedence, so the black line had to pass under it, as volume moved from below to above normal.

Above normal? Did I say the volume is above normal? Yes. But do not expect Alarmists to bring the subject up. They are quite glum about it, and tend to ignore the DMI graph and flee to the PIOMASS data.  But here is the DMI graph they don’t like to look at. It shows volume plunging in the way it plunges every year,  but above-normal. In the past year we seem to have seen an increase of over 4500 km³ of sea-ice.

Volume 20180619 FullSizeRender

Where is the ice increasing? Here is a comparison of the thickness of the ice last year (left) with this year (right).

There is more open water north of Svalbard and in the Laptev Sea this year, but the sea-ice is obviously thicker towards East Siberia and in the Central Arctic.

Of interest to me is the area north of Bering Strait. Alarmists felt the melt would be faster this year than last year, for waters south of Bering Strait were surprisingly ice-free last winter, and Alarmists felt this would give those waters a head start , in terms of warming, and that warmer water would head north of Bering Strait, and hasten the melt in the Chukchi and Beaufort Seas. This hasn’t happened yet, though the waters are warmer than normal in Bering Strait.

SST anomaly 20180618 anomnight.6.18.2018

Just a reminder: The above map shows anomalies. The cherry red in Bering Strait does not mean the water is warm. Rather it means it is roughly 3 degrees above normal, or in other words +2°C rather than -1°C (which would be the temperature of the water with bergs floating around in it.)

Further south the La Nina is fading and an El Nino appears to be building. Oddly most of the warming is north of the equator, so far. Any warming effect due to an El Nino will be in a lagged manner, and we likely will still be seeing the lagged effect of the cool La Nina for a while longer at the Pole.

The Atlantic side is very interesting, as the backwards “C” of cold in the Atlantic is the signature of a cold AMO, which we haven’t seen in a long time, and were not expecting for another five years. NOAA will have to update the x-axis of its AMO graph, for the most recent “+” for the month of May is just into the negative, and you can only see part of it poking up at the very bottom right of their graph.

AMO May 2018 amo_short

This cold AMO is making conditions colder in southern Greenland and eastern Canada. This is of concern to people on the east coast of Hudson Bay, where the sea-ice is hanging tough. (2017 to left; 2018 to right.)

The concern involves getting a tanker to the east coast settlements, because people no longer heat igloos with blubber lamps, nor spend the entire winter fully dressed. Or maybe they could, but most prefer fossil fuels and warm houses. Therefore all are in a hurry to refill fuel tanks during the window of opportunity offered by the Bay being ice-free. It’s a problem when the ice hangs tough. People don’t sit around drumming their fingers waiting, because it would be downright dangerous to go without resupply.

I remember a clamor arose in 2015 when the ice hung tough into July, and the people in the east coast settlements asked for an icebreaker to clear a path for their oil tanker. Of course this didn’t make headlines. I only knew about it because some Climate Scientists had hired the icebreaker so they could study how the ice was vanishing, and instead the ship was diverted to where the ice wasn’t vanishing. I did not fail to note the irony, but also was puzzled, for the maps and graphs I used didn’t show all that much ice, but then I saw this picture of the path being cleared on July 17.

Hudson 2015 Icebreaker hudson-july-28-3-ccgs-pierre-radisson-in-sea-ice

I hope this explains why I sometimes seem distrustful of maps and graphs. When possible I seek out the Twitter and Facebook feeds from ships and small towns, because a reporter who is actually on the scene is best, even if they are unpaid by any newspaper.

In any case, I’ll be keeping an eye on Hudson Bay.

The cold AMO seems to be effecting Greenland as well. The yearly thaw has started around the edges of the icecap, but there are also some heavy snows. For example, yesterday heavy snow fell in the northwest.

Greenland MB 20180619 todaysmb

Of course, if more snow falls than melts then it is hard to be a true Alarmist about the icecap melting away. For a while this year’s “accumulated mass balance” roughly paralleled  2011-2012, which was a great year (if you like to worry about melting), but roughly a month ago the two years parted ways, and where 2011-2012 fell like a stone, (red line), this year refused to start falling (blue line).

Greenland MB 20180619 accumulatedsmb

One final effect of the cold AMO: Some fishing lodges in eastern Canada are taking a financial hit, for it is difficult to operate a fishing lodge when six feet of winter snow sits outside, refusing to melt. The picture is from Labrador in mid-June. (Hat tip to Ice-age-now site).

Fishing Lodge in June labrador-snow

The fishermen may be sad, but I understand the trout are tickled pink.

Stay tuned.

ARCTIC SEA-ICE –The Newfoundland Crunch–UPDATED

Crunch 1 FullSizeRender

The coast of Newfoundland is an excellent example, this year, of how the sea-ice”extent” graph can decrease even as the “volume” graph increases. In the middle of February the sea-ice had spread far from the coast, to the cross-hairs formed by the 50° W longitude and 50° N latitude lines.

Crunch 2 FullSizeRender

However a month later we see that the area the ice covered has shrunk back to the west.

Crunch 3 FullSizeRender

Initially one might think the decrease in extent was due to melting, but then we notice how thick the ice is along the Newfoundland coast. What has happened is that a series of nor’easters, which gave headline-making snows in the northeast of the USA, created persistent east winds to the waters off Newfoundland, pushing all the ice towards the shore, where it piled up. In actual fact the “volume” of this particular bunch of ice likely was roughly the same, but the “extent” was greatly reduced.

When the sea-ice piled up to such a degree it became a problem. Or actually a number of problems.

The first problem was that boats up in those waters are built to handle ordinary sea-ice, which tends to be a foot or two thick, and a bit slushy in its consistency.  It is not the same thing as the huge and beautiful icebergs that drift down to those coasts after calving off massive glaciers up in Greenland. It is sea-ice a boat can motor through. But when east winds persist the ice piles up thicker and thicker, and this year reached thicknesses approaching thirty feet. At that point the smaller boats became stuck, and a few even were sunk, and icebreakers and helicopters need to be called to the rescue.

Crunch 5 la-scie-fishermen-rescued-from-boat-suck-in-ice

This creates a second problem. Certain climate scientists have been warning that all the sea-ice was melting away and polar bears would have no ice to stand on, and would drown. To have ice thirty feet thick along the shore placed these gentlemen in an embarrassing situation. Like a boy with undone homework standing in front of an Algebra teacher, they needed to think, and think fast.

I must give the fellows credit. If they were standing before an Algebra teacher, their excuses would cause the entire class to rise and give them a standing ovation.

Basically their excuse was that less ice made for looser ice, that was more able to shift and crunch up against the coast. In order to understand this lovely excuse you need to understand the concept of “fast-ice.”

Fast-ice is actually ice that is slow. It was so slow that it was “frozen fast” to the shore, where it can remain for years, during periods when the climate is cold. When the climate warms, large areas of fast-ice can break off. It is very different from “shelf-ice”, which is far thicker and derives its origins from glaciers. Fast-ice derives its origins from sea-ice, and is seldom thicker than thirty feet. Fast-ice bergs are far more crumbly than the huge bergs than can sink a Titanic,  for they are made of compacted chips of ice and slush, as opposed to glacial bergs, which are solid ice. A slab of fast-ice tend to quickly revert to many small chips of sea-ice, and a thirty foot thick slab can then spread out like butter over bread to cover a larger area with chunks of sea-ice, causing a confusing rise in “extent” even as weather warms.

In any case, the excuse now being given for the situation along the coast of Newfoundland gets double points, for not only does it explain the ice getting there, but also explains the larger chunks of sea-ice which are in the mix.

According to this excuse hypothesis, before Global Warming happened all the ice was held to the north as fast-ice, and the thinner fast-ice formed a wall that held the thicker fast-ice in check behind it. Now Global Warming has melted the thinner fast-ice, which allows the thicker fast-ice to come south.

I hope you recognize the beauty of this excuse explanation. Now not only does Global Warming explain more sea-ice, but it also explains bigger chunks of ice in the sea-ice. Because bigger chunks may damage and even sink small boats, it becomes all the more important to raise carbon taxes on hard-working fishermen, and fund climate scientists.

But there is one small, third problem. We have the records of sailors going back into the past, and can look to see if indeed fast-ice held sea-ice to the north.

The route to the posts of the Hudson Bay Company in Hudson Bay tried to avoid the sea-ice that moves south down the west side of Baffin Bay and along the coast of Labrador, by sailing along the east side of Baffin Bay, but to enter Hudson Bay they had to cross over and penetrate the river of sea-ice. And when did these voyages start? Well, the “Nonesuch” sailed up there and then down to the very south of Hudson Bay in 1668, and founded the first post. So we have 350 years of records, showing that some years the passage was easy, and some years the passage was blocked.

“Oh, well”, you may say, “That only shows the passage was possible because the lack of Global Warming kept the thicker sea-ice trapped behind fast-ice to the north”.

But here we face a fourth problem. Besides traders after furs there were whalers after whales, and they sailed farther north. In fact, after what was likely an amazing discharge of sea-ice around 1816-1817, one whaler is even reported to have sailed up the east coast of Greenland, around the top, and down the west coast.

Also, besides the whalers, there was a whole slew of British explorers attempting to navigate and map the Northwest Passage in the first half of the 1800’s, and they quite routinely navigated through Baffin Bay.

Lastly, members of the ill-fated American “Polaris” expedition, after steaming up to the to the top of an open Nares Strait in 1871, became separated from the ship and were marooned on an ice flow at the bottom of Nares Strait in 1872. What better proof could you ask for (that the sea-ice was mobile) than to have a group of men ride it all the way south along the west coast of Baffin Bay and onward, over 1800 miles,  to where they were rescued off the coast of Newfoundland in late April 1873 by sealers.

Crunch 6 Polaris_Expedition_route

All in all, judging from the sea-ice conditions reported in the past, I have to conclude the excuse hypothesis that sea-ice has only recently come south, because Global Warming’s melting freed it, has been refuted. However I do give climate scientists an “A” for effort.

Perhaps there was more fast-ice during the Little Ice Age, but it seems the flow of sea-ice down the west side of Baffin Bay, and even through Nares Strait at the top of Baffin Bay, is a persistent geological reality, even in cold periods.   Perhaps it may briefly halt during an especially cold winter, but ice grinds south along the northeast coast of Greenland even when winds are at -40°, only rarely becoming fastened to the shore for a while, and I can see no reason Baffin Bay should differ.

In conclusion,  the flow of ice down the west side of Baffin Bay and along the coast of Newfoundland has varied, and still can vary, greatly. Some years there is little, some years there is a lot, some years the ice freezes solid to the shore and becomes “fast-ice”, some years big areas of fast-ice break lose and swirl south. The people of Newfoundland have learned to grin and bear it, but likely appreciate the efforts of climate scientists to bring reporters north, for it increases the tourist trade.

Sadly, when reporters focus in on the trials and tribulations of the people up there, when east winds pile the sea-ice up along their coasts, the climate scientists hog the spotlight, and there is hardly any reporting of what the fishermen suffer. Is it only climate scientists who deserve pity?

http://www.cbc.ca/news/canada/manitoba/arctic-sea-ice-research-1.4583150

*******

It took some digging, but I did finally find news about the fishermen.

http://www.cbc.ca/news/canada/newfoundland-labrador/fishing-boats-stuck-ice-la-scie-1.4151075

Crunch 4 fishing-boats-la-scie-returning

ARCTIC SEA-ICE –Vortex Hubbub–

My favorite long-range forecasters, Josrph D’Aleo, Joe Bastardi and Tom Downs over at Weatherbell, forecast a sort of sandwich winter back in October. That is: Two slices of bitter cold with a thaw in the middle. They have gotten the first two parts, and now I’m adopting a wait-and-see attitude about the third, but I must admit it increasingly looks like they have hit the nail on the head. If the long term forecasts prove true, that team deserves confetti and a parade, or at least some kudos (whatever those are), because predicting a winter the October before it occurs is danged hard.

I don’t usually pay much attention to upper atmosphere stuff, as it is over my head, but I do note the high clouds on days I can see up that far, and know a few old-timer rules concerning the various types of cloud, how fast they are moving, and the direction they are moving in relation to the winds down here on earth. So far I have seen nothing all that alarming, but did order an extra load of firewood, due to this couplet:

The longer and stronger the January thaw
The more that February’s snowstorms will awe.

I figure this is largely common sense. Weather is seldom “normal” or “average”, but rather tends to swing back and forth between warm spells and cold spells, so it is quite pragmatic to expect a colder February after a warmer January. Also, because spring starts in February way down south on the Gulf of Mexico coast, storms can access some warm, juicy air in February, which can feed storms like gasoline into a fire, and brings us people to the north some amazing February and March falls of snow.

But what has this to do with arctic sea-ice?

Largely it is due to the fact the Arctic Ocean is the source of our coldest air. The way winds howl up there influence us, as well as the movement of sea-ice. Also, though it has less influence on sea-ice than winds do, if the arctic is robbed of its coldest air sea-ice will form more slowly and less thickly. (For this reason biased Alarmists tend to focus on times the arctic is above normal, utterly ignoring the not-inconsequential fact we bumpkins down south in New Hampshire are freezing our socks off.)

In any case, one phenomenon that influences both sea-ice and New Hampshire is a strong cross-polar-flow from Siberia across into Canada, and then down to New Hampshire. These winds create polynyas of open water along the Siberian coast, as ice is shifted across the Pole via the Transpolar Drift to smash as impressive pressure ridges against Canada.  At first this lessens the area of sea-ice, but then the polynyas freeze over, and the sea-ice recovers back to what it was, in terms of “area”. But in terms of “volume”, no sea-ice has melted, and the total amount has increased. (You have to pay attention to such details when in discussions with biased Alarmists, due to their tendency to pick and chose only the data that supports their bias.)

So far the winds down at the level of the sea-ice have been mostly gentle, but I do notice when the winds aloft are more vigorous. This is not to say I understand what is going on up that high, but just as old-timers around here notice the antics of high clouds, I’m sure savvy old Eskimos are noticing the high clouds streaming south, and coming to conclusions. Therefore I perked up when Ryan Maue  tweeted about a “vortex”, way, way up at the tropopause, getting whipped across from Siberia all the way down to another “vortex” located over Hudson Bay. I have yet to see any sign of this cross-polar-bullwhip translating down to the surface, but it does make me pause and scratch my jaw a bit.

https://twitter.com/RyanMaue/status/958200172827246595

Also the meteorologist Judah Cohen produced a comparison of the “Vortex” as models forecast it to be on February 3 with how the situation looked during a very cold period back in 2014. (2014 to left, with North America at six o’clock. 2018 forecast to right, with North America displaced to eight o’clock.)


Judging from all this above-my-head stuff, history could repeat itself, and we could see a return to bitter winter. However so far our down-to-earth maps don’t show it.

20180130 satsfc

Though we are currently getting some north winds from the low developing out to sea, they are nothing like the blasts we got after Christmas. Our current “cold spell” will get down to 17°F (-8° C), but you would be surprised at how kindly such temperatures feel, after your body has acclimatized to windchill of -30°F (-34°C). Not that I don’t hunch my shoulders a bit against the chill, but I have noticed fellows younger and more hotblooded than I sauntering about with their jackets unzipped. And this is a cold spell? If you look west in the map you can see plenty of Pacific air leaking into the flow, diluting and moderating the winter. West winds are so different from north winds, in New England, that I can see why Indians felt different angels in the spiritual hierarchy, (wherein God [or the Great Spirit] is the only One worthy of worship),  were in charge of the west wind. After bitter blasts from the north, west winds, even when not a true Chinook, are downright kindly.

Therefore there is no real short-term reason for alarm. True, the meteorologists who focus on the upper atmosphere have a better record for correct forcasts, but sometimes even they are wrong. In fact I hope they are wrong. I don’t like bitter cold. However when they agree with old-timer’s maxims, I am especially inclined to take heed. And I remember,

The longer and stronger the January thaw
The more that February’s snowstorms will awe.

And for this reason I have made a complete mess of the side lawn of the Childcare.

Woodpile FullSizeRender

The wise old Indians used to say, “if you want to know how bad the winter will be, look at the white man’s woodpile.”

In terms of arctic sea-ice, having the “vortex” move down to Hudson Bay should lead to above-normal temperatures over the Pole as a whole, but we will have wait and see how the cross-polar-flow translates down to the surface. Having very cold air blast from Siberia to Canada will please Alarmists with polynyas along the Siberian coast, but that coastal ice is far thicker than last year, and shifting it across the arctic could lead to far thicker ice in the Central Arctic.

Stay tuned.

ARCTIC SEA ICE –Ice Traps Narwhals–

One thing that has fascinated me, in my study of sea-ice, is how swiftly vast areas can freeze over. This is apparent from many sources.

The captains of whaling ships, tempted north by whale’s habit of hunting in the rich ecosystem that exists at the very edge of the ice, sometimes appear like cowards for turning tail and fleeing the refreeze far before the whales chose to depart. (You might think whales would know best when to depart, for they suffocate when trapped under ice). However this choice does not seem so foolish once you understand larger whales could break up through a foot of ice, (with smaller beluga whales following and using the air-holes big whales created), while, without a strong following wind, a sailing craft could be bogged down and halted by a skim of ice only an inch thick. And despite all precautions, the ice formed so swiftly some years that whaling ships, and sometimes entire fleets of ships, were caught by the ice, resulting in some remarkable stories of survival.

The O-buoy cameras captured the refreeze on several occasions, and it always was remarkable how quickly it occurred. One day the buoy would be bobbing in open water, and then suddenly there would be a lot of slush swiftly transformed to solid ice.

The refreeze happens so swiftly I’ve taken to calling it a “flash freeze”.  The phenomenon is particularly striking in the vast but relatively shallow waters of Hudson Bay.  Several times I’ve made Alarmists look silly by drawing them into a sort of a trap, pointing out the open waters of Hudson Bay in late November and getting them to claim the open water is a sign of Global Warming; then the entire bay freezes over even as the discussion continues, (because some debates go on and on and on, for days, at some websites.)

Last year the jet stream resulted in south winds, and the freeze was late on Hudson Bay, but this year sees north winds (caused by the same looping jet that results in less ice in Bering Strait). Below is a comparison of the ice on the two years, with the lilac hue representing ice roughly a foot thick, which is enough for polar bears to walk on. (2016 to left; 2017 to right).


To me a change in the first formation of sea-ice by weeks doesn’t mean much. Back in the early history of the fur trade there are records of years when the sea-ice formed very late, followed by years when the Hudson Bay post could not be resupplied, for the ice was so thick and the summer so cold that the sea-ice never melted.  The change of the past two years is merely indicative of natural variation. However for some Alarmists the fact that the ice formed earlier this year causes deep depression, for they feel the change should be in one direction to be a true “Death Spiral”. Instead they see a dead spiral.

Slinky tangled 8532040475_67e4f48a27_b

A depressed human mind clicks into problem-solving mode, which in some cases turns Alarmists into Skeptics, but in other cases causes Alarmists to look further afield to seek verification of their belief.

One “verification” I have heard involved the suggestion that such variations have increased, due to Global Warming, and this is proven by the fact that narwhals, which are adapted to the Arctic, are “now being trapped” by the “changed” formation of ice. I haven’t yet heard the claim this fall, but fully expect it, because the formation of ice in Hudson Bay was “ahead of normal” while the formation of ice in Foxe Basin to its north was “later than normal”. To have waters in escape-routes freeze before waters further north creates the conditions that cause entrapment.

Narwhal 3 hudson-bay-weekly-departure-from-normal-2017-nov-20

In actual fact, the cause of below normal ice-formation to the north is likely not because the ice didn’t form ahead of schedule, but rather because howling north winds blew the newly formed ice away from shore, forming a polynya of open water. It is unlikely whales could even get to such open water, not only because sea-ice lies in the way, but also because they aren’t stupid. (Also polar bears are not endangered by such polynyas; they simply ride the sea-ice, when it blows away from shore, though mothers with cubs are more prone to keep their cubs on shore. Also some older males, who are usually first to move out to sea, perhaps are savvy to gales, and in no hurry to head out when winds howl from the north.)

Whales do become entrapped, despite their natural wisdom, and it usually involves a field of pack-ice that formed in the north moving south across the mouth of a bay.  As Narwhals live to be fifty, likely the older whales know enough to avoid such entrapment, but even they can be trapped by once-every-hundred-year conditions they’ve never seen before. Old reports tell of a thousand narwhals being entrapped in Disko Bay in 1915 (which is too early for Global Warming to be a cause).

All the same, an entrapment of narwhals does tend to excite the Alarmist media, leading to claims Global Warming is to blame. Here is a Canadian article from two summers ago:

http://www.cbc.ca/news/canada/british-columbia/unicorn-of-the-sea-1.3718732

Rather than becoming upset by such blather, I have found it rewarding to simply do the fact-checking that the editors used to do, but now seemingly are too lazy (or politically invested) to do. Often I find myself going on voyages from my armchair, seeing sights I’ve never seen before, and learning wondrous things. The photographs alone can be strikingly beautiful.

Narwhal 4 narwhal

While there is an unspoken insinuation, in the above article, that the narwhals  in the above picture are entrapped, I can find no statement that they actually were. Apparently is was a picture “from files”. Narwhal are superbly adapted to life among ice floes, and there is no indication their populations are endangered. However the researcher in the above study wanted to learn more about the narwhal’s horn. (And who will pay for such study? Not most businessmen. However there are heaps of money spent on Global Warming, as long as you promote its reality.)

The narwhal’s “horn” is actually a single tooth, usually seen only in males, but also in 15 % of females (in a few cases they have two). Like most teeth they have a nerve in the middle. In the narwhal’s case the nerve is highly developed. What is it sensing? Some have suggested it may amount to a sixth sense, able to detect salinity (which increases and decreases as sea-ice freezes and thaws). What is even more interesting is the idea (which could be balderdash) that when male narwhal tap their horns together it has nothing to do with male rivalry, but rather is a way of exchanging information gathered by this sixth sense.

Do you see what I mean about the wondrous ideas you can chance upon from an armchair? I also learned that Vikings could make a fortune by harpooning a narwhal, because, a thousand years ago, the horns were worth more than their weight in gold. (This alone justifies the existence of the Greenland colony, even when the farms became unprofitable. )

To return to the subject of entrapment, they do occur, and are a boon to those who stand to profit. That tends to be polar bears, who can grow so fat from clawing and hauling the whales up onto the ice and gorging on them that their bellies drag on the ground. Also men stand to profit. During the entrapment of 2008 off Pond Inlet, the bureaucrats involved were smart enough to see the whales were doomed and going to die whether they were “harvested” or not, and waived ordinary quotas of around 130 narwals, allowing over 200 extra whales to be harvested from the entrapment. (As the local population of narwhal was 20,000, this did not constitute serious over-hunting.) This boon was shared with others in the Inuit community, (though I imagine some tree-huggers to the south were horrified, and felt an ice-breaker should have been deployed to free the whales), (unless they themselves had to pay for such a rescue).

http://www.nunatsiaqonline.ca/stories/article/Hundreds_trapped_by_ice/

Though such entrapment is awful, if you are a narwhal, they are apparently a fact of life, like car crashes on super-highways are for humans.

Narwhal 6 A_polar_bear_(Ursus_maritimus)_scavenging_a_narwhal_whale_(Monodon_monoceros)_carcass_-_journal.pone.0060797.g001-A

The pity is that Alarmist media cannot seem to educate the public, and doesn’t do a little reading-up on the subject, but rather seems determined to horrify. Horror is not helpful, unless your intent is to herd people with a sort of bullying. To paraphrase FDR, in truth we have nothing to be horrified about but horror itself.

In some cases I don’t blame some scientists for promoting their own area of interest by making it seem more important than it actually is. However when scientists hurt other scientists for bringing up points which suggest their area of interest is not as important as they suggested (as may very well be the case with Global Warming) I think they are stepping over the line, and have left the bounds of civilized behavior.

This was recently the case when a group of scientists attacked Susan J. Crockford, suggesting she had no business talking about polar bears. In actual fact she is a highly qualified zoologist who has long studied and written about arctic wildlife, including polar bears. One scientist who attacked her was Michael Mann, who hasn’t studied polar bears very much at all, beyond their status as a political icon, yet who has himself written papers containing data that caused them to be soundly debunked. He needs to clean up his own work before criticizing others.

A fine example of Susan J. Crockford’s work actually involves the entrapment of narwhals, and can be found here:

Narwhal and beluga ice entrapment is natural – not caused by global warming

One thing I notice about Susan’s posts is how careful she is to give references for every point she makes, and all data she uses. She is a good example of fact-checking which puts me to shame, and should put the media to even greater shame.

Another thing I notice is that in her posts “comments are closed”. I think she doesn’t want to spend time moderating the comments likely to appear, or to deal with internet “trolls”, whom I know, from personal experience, can be nasty, and can draw you into debate that is fairly useless because they have no real interest in what you are saying. (I myself sometimes get a sort of pleasure in battling such trolls, but I can understand anyone who doesn’t have time for it.) Susan gets enough grief from climate scientists, and has no need to seek extra grief from trolls.

A last thing I note is that her posts do have a tab for “tips and notes”, and I know that if I write a polite letter I will get a polite response. (In my case she kindly has pointed out my factual blunders, which I am grateful for.  The pity is that her fellow scientists are not equally grateful for her sterling work.)

In the end it is likely we will not often receive the kindness we crave, from our fellow man. Such kindness is a beautiful rarity on this planet, and if I don’t receive any on a gloomy day I try to give some. Also I find that if I simply go out and study what our Creator has created I see beauty, and that gift is a beautiful kindness I don’t feel I’ve earned, and I accept it with gratitude. There are Christmas gifts all around us.

Narwhal 5 Pod_Monodon_monoceros


ARCTIC SEA ICE –The Surge Snipped–

The Pole continues to make for interesting theater, though the drama has died down from what it was a week ago, when temperatures were soaring to 35 degrees above normal and the ice at the north edge of Barents Sea was retreating. Fueling this weather was a strong south wind from the Atlantic that at times pushed right past the Pole towards the Pacific, thus confusing everybody, because a south wind became a north wind without changing direction.  This flow achieved its peak around November 14:

By November 16 the flow was pushing an Atlantic low and its secondary up through Fram Strait, whereupon, due to the strict laws of this website, they are automatically dubbed “Ralph”. The southerly flow, while remaining southerly, had swung east, and was now coming less off the Atlantic and more off shore from Europe, but it nearly was able to push above-freezing temperatures to the Pole.

So strong was this flow that the sea-ice, which usually is expanding south as a thin sheet of ice, was pushed north by strong wind until it was briefly well north of Franz Josef Land, and unable to refreeze because temperatures were above freezing in that area. This produced a brief and unusual dip in the ice “extent”graph, which usually is rocketing upwards at this time of year. However the ice swiftly grew back down to Franz Josef Lands’s north coast as conditions began to change, and the graph resumed its upward climb.

dmi4-1123-osisaf_nh_iceextent_daily_5years_en

The surge from the south had raised eyebrows by raising temperatures to unprecedented levels (in a history that goes back 58 years).

dmi4-1116-meant_2016

However my eyebrows were raised by the steep decline that followed.

dmi4-1126-meant_2016

This interested me because, whereas other places can get colder air from lands further north, there is no place north of the North Pole. Therefore it must get cold air imported from colder tundra to the south, but I didn’t see any strong flow from such tundras. This meant the cold must instead be home grown. Or, to put it more scientifically, the heat was lost locally, radiated upwards into the unending winter night.

Still, it seemed odd to me that the warm southerly flow should just turn off like a spigot. My curiosity sought reasons, for the cessation was obvious as early as November 17, because the first and second lows, following a storm track straight north to the Pole, (incarnations of “Ralph”), weakened with surprising speed. It was as if they were cut off from their warm inflow of mild, moist air, while the third storm in the sequence came to a dead halt and refused to head north, and just sat off the coast of Norway and twiddled its thumbs, remaining fairly strong.

I wondered if the stalled low off Norway might be consuming all the available energy, but this didn’t satisfy me, for the isobars in the above map still indicate a strong flow from the south. Why wasn’t the warmth heading out over arctic waters? The temperature anomaly map still showed the above-normal temperatures moving north in central Europe, but then being bent east at the top. What was stopping the import of heat north to the Pole?

surge-7-gfs_t2m_anom_eur_21

I’d likely still be mystified, but dawn broke on Marblehead when I visited Joseph D’Aleo’s blog over at the Weatherbell Site, and during the course of one of his elegant descriptions of complex situations he turned on the light-bulb in my noggin.

Just as a meandering stream straightens its course from time to time, cutting across the neck of a loop and leaving an oxbow lake behind

snip-1-a8dcd06cd8cd3559b399ecc64af3a2032812ccf0

So too can a loopy jet stream decide to straighten up its act, and the “surge” was part of a loopy jet:

snip-2-screen_shot_2016_11_23_at_5_15_03_am

When a jet straightens up it act, the cut off part of the stream is not called an “oxbow”, but rather a “cut off”, (which shows that meteorologists are occasionally more sensible than geologists).  By November 23 the upper air maps showed the “cut off low” was sitting down over Spain. Over Spain a large part of the surge was no longer heading north, but caught up and going around and around and around, like a taxpayer caught up in a bureaucracy.

snip-3-ecmwf_uvz500_eur_5

You will notice that at the top of the above map the jet is basically zooming west to east. The surge from the south has vanished, making a mess of all my forecasts that calculated the surge would move east this far one day, and this far further east the next. The surge simply disappeared, or at the very least fell over and surged west to east. It was confusing. (Actually the same thing happens when I straighten up my own act. It confuses people who depend on me to be loopy.)  In any case, this morning’s surface map had a reflection of the cut-off-low stalled over Spain, but what about the North Atlantic low? It will plow west-to-east across Scandinavia in the jet, nothing like the lows that headed straight north, last week.uk-met-20161126-42268142

The tipped over surge can be seen giving some relief to central Asia in the temperature maps.

snip-4-gfs_t2m_asia_2

In the anomaly map the west-to-east surge looks like an arrow, making a layer cake out of the map (to mix my metaphors). The old cold is to the south, still capable of generating a few headlines, but likely to be slowly moderated out of existence. The new cold is along the top, and likely needs to be watched, for it seems likely to be a lasting feature. The “surge” itself seems likely to linger but weaken, but will remain interesting to watch.  At the very least it will give some Asians a break, after they have been through an autumn colder than some winters.

snip-5-gfs_t2m_anom_asia_2

But this is all off the point, which was (in case you can’t remember), that the mild air is not surging up to the Pole any more, and that the vast pool of mild air that was transported up there is slowly cooling, day by day.

I should note that Joseph D’Aleo mentioned that when a jet really gets roaring west to east it can act downright human. (After humans have straightened out their act, what tends to happen next? Answer: Their resolve buckles.) In like manner, we should be on our toes, watching for where the jet will next buckle, and get all loopy, (like a human falling off the wagon after keeping a New Year’s resolution as long as they can bear it).   However, for the time being, up at the Pole, “Ralph” has little hope of reinforcements from the Atlantic.

Not that “Ralph” has vanished completely. Largely he has retreated to the Canadian Archipelago, as high pressure dominates the Arctic. At the end of my last post there actually was a small ghost of Ralph by the Pole, and hint of Ralph’s “signature” in the temperature map, hooking mildness towards the Pole, despite the power of the expanding high pressure. (See the tiny low by the Pole?)

The next day Ralph’s ghost was just a dent in the high pressure’s isobars. Freezing temperatures had snuck down to the northeast coast of Svalabard.


The next dawn Ralph, like all good ghosts, was vanishing, because that is what ghosts do at dawn. (If you you squint you can still see a microscopic low under the Pole.) The only real import of air towards the Pole was from central Siberia.

The following dawn saw an odd dimple in the high pressure’s isobars, on the Canadian side. It looked like (if you use your imagination) a face, that the ghost of Ralph had punched. Freezing temperatures were engulfing Svalbard. By evening the ghost of Ralph reappeared, (as good ghosts do at dark), just north of the Canadian Archipelago.

Today saw the freezing isotherm slump well south of Svalbard, and Ralph retreat and regroup north of Canada. Models are suggesting Ralph will soon start attacking the Pole from the Canadian side, though with colder air than before. The North Atlantic flow is totally from the north, and Scandinavia looks likely to get a dose of north winds.

The north winds are allowing the sea-ice to build south again where the “surge” had forced it to retreat, in the north part of Barents Sea, and sea-ice is again touching the north coast of Franz Josef Land. There was also a slight reduction on the Pacific side, due to strong south winds and a brief mild inflow a week ago, but that has been more than made up for by regrowth, which has now engulfed Wrangle Island.

concentration-20161125-attachment-1

A major difference from last year is that Hudson Bay was half skimmed-over last year, and the refreeze hasn’t even started this year. I think this will soon change. The Bay’s waters are shallow, and it tends to freeze over with remarkable speed, which contributes to the speed of the growth of the “extent” graph.  I’ll bet a nickle the Bay is entirely frozen by Christmas.

Even though the flow from central Siberia has been weak, it appears to have nudged the thicker ice just off shore, in the Laptev Sea. Watch for the formation of polynyas along the shore there, for that is indicative of the export of ice into the Central Arctic Basin.

Baffin Bay is swiftly icing over, but remains behind last year’s rate of growth..

The Kara Sea’s sea-ice shrank back before the “surge”, but that sea has since swiftly grown sea-ice on its eastern side.

The reversing winds have seen multi-year ice start down through Fram Strait, along the east coast of Greenland, but the ice down towards the coast opposite Iceland in Denmark Strait is largely home grown.

thickness-20161125-attachment-1

I’m not sure how it is possible, but some models see a colder version of Ralph moving up from Canada to regain complete control of the Pole in a week to ten days. Stay tuned.

LOCAL VIEW –June Refresher–

When I looked at the map this morning I was actually looking south of Texas, because Joe Bastardi said there might be tropical development down that way, over the next week or ten days, and he has already completely dropped my jaw by nailing the last two early-season tropical developments, something like two weeks ahead of time. Considering I am lucky to tell you what will happen this afternoon, I find it pretty amazing when the long-range experts hit the nail on the head, though Mr. Bastardi was rather ho-hum about his success, (perhaps because the tropical storms weren’t all that big.) In any case I did note a bit of a flare-up way down in the Bay of Campeche, and then turned my gaze from the tropical to the arctic, which, in a sense, currently is in my own back yard. Not that it is called “arctic” in June; rather it is called “polar”.

If you look at the map you can see a low northeast of Nova Scotia  is blasting us with refreshing air, which is actually coming down from Hudson Bay, which still is ice-covered.

20160610 satsfc

The nice lobe of cool, Canadian air extends as high pressure from Hudson Bay right down to Georgia, but, although its east side has north winds and continues to rush the refreshment south, the west side has south winds and sweltering heat is coming north in the center of the USA.

You’d be surprised how often this is the case in New England. We are climate unto ourselves, as different from the body of the nation as a head is from a torso.  (People from other parts of the USA might use other body parts in the analogy, but I won’t go there.)  It is no fun when we get cold fog and drizzle when the rest of the nation gets summer, but when they’re sweltering, as we enjoy sparkling weather, we get our chance to be smug.

Cool June 2 IMG_3114

Cool June 8 IMG_3137

I was a bit tired at the start today, as I have to put in some overtime taking blasted government-mandated on-line courses when I should be sleeping. Last night I learned children should have less “screen time” at Childcare, (we have absolutely none, as children get plenty of TV, video games and computer time at home, and anyway, Bill Gates didn’t spend time on a computer as a child and still managed to develop “computer skills”.) I also learned children should get at least an hour of strenuous exercise a day. (Our kids are outside all day long, and tend to learn under trees like philosophers of ancient Greece.) I learned parents are not responsible for the welfare of children, but teachers are. I learned that children once learned to hop, gallop and skip from older children, but because families are now smaller and children are grouped with others of the same age, they must be taught to hop by teachers. There was instruction on hopping correctly, and on safety while hopping. (My eyes were rolling so much it made a sound like bowling balls rumbling down a bowling alley.) There was a section on getting cheaper toys, because getting a few expensive toys might make children quarrel. (The kids at our childcare seem to demonstrate that a stick is their favorite toy, and even though there are thousands of sticks in the woods, they still manage to quarrel about who owns a particular stick.) While discussing the expense of tricycles, I saw that besides tricycles there was the expense of helmets. Yikes! I had no idea tricycles were so dangerous. I’ll have to buy a parachute for one our four-year-olds, who loves to swing.

Cool June 3 FullSizeRender

In any case I got 100% on the test at the end, because I know the right answers even though I may not agree they are right. Then today we headed off on a beautiful cool morning.  The children think nothing of playing their way across three miles by lunch.Cool June 5 IMG_3158

The children are in the far distance, with a member of my staff. I don’t keep them in shape. They keep me in shape, just keeping up with them. This path is the top of an earthen dam at “Hadley’s”  ( a flood control reservoir) and the children are on their way to Checkerberry Woods”.

Cool June 4 IMG_3153

They headed north along the “Hummock Trail” to a small brook.

Cool June 9 IMG_3139

Some parents worry that we don’t teach enough Math, so I videoed a child taking my class on fluid dynamics, turbulence, and Strange Attractors.  (It is “strange” how children are “attracted” to running water.) Parents love seeing their children hard at work at academics.

Cool June 7 IMG_3160

We had a hard time making back in time for lunch, for the wild strawberries are ripe, and the children love to graze on the tiny berries. The berries are not “certified organic”, but I figure nature can’t be bothered with government regulations.

The peas the kids helped me plant are already blooming, though there was a major cold wave after they were planted, with snow and temperatures down in the single digits (F). They had sprouted, but I lucked out as they hadn’t quite emerged above the dirt. The kids likely will be munching edible-podded-peas next week, which is very early for this far north. The old saying was that you plant peas on Patriot’s day (April 19) and pick them on Independence day (July 4).

Cool June 1 IMG_3111

Of course, with the air whooshing down from Hudson Bay, we might get frost. That is one danger of our refreshing escape from the sweltering heat further south. The maps show frost (light pink)  was close this morning, and will lurk in hollows tomorrow morning.

Refresh 1 gfs_t2m_east_1Refresh 2 gfs_t2m_east_5

Another danger is thunder, when the sweltering air finally pushes north and charges over us, and Sunday morning dawns 25 degrees warmer.

Refresh 3 gfs_t2m_east_9

However the heat seldom holds, in June in New England, and by the time I head back to work on Monday morning more air will be swaying the green boughs, clear and clean and crisp and straight from Hudson Bay.

Refresh 4 gfs_t2m_east_13 (Warning.  The weather is so gorgeous this website has been put under a poetry alert.)


ARCTIC SEA ICE –The Newest Nudger– (Concluded with Wednesday AM Surprise)

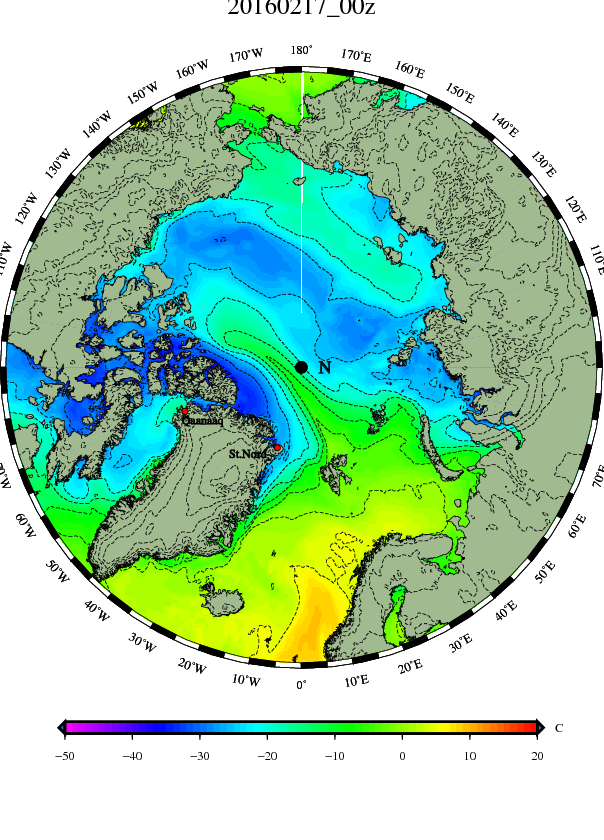
The past week has seen an interesting change up at the Pole. The high pressure that has been stubbornly parked up there on the Canadian side has drifted over to the coast of Central Siberia, and elongated. This has created a two way street of Cross-Polar-flows, one bringing Pacific air along the East Siberian coast, and another bringing cold Siberian air the other way across to Canada and also a spear of milder Atlantic air right over the Pole as far as the Canadian coast.

DMI3 0213 mslp_latest.big DMI3 0213 temp_latest.bigDMI3 0214B mslp_latest.big DMI3 0214B temp_latest.bigDMI3 0215 mslp_latest.big DMI3 0215 temp_latest.bigDMI3 0216 mslp_latest.big DMI3 0216 temp_latest.bigDMI3 0217 mslp_latest.big DMi3 0217 temp_latest.bigDMI3 0217B mslp_latest.big DMI3 0217B temp_latest.big

I’ve been watching these invasions carefully this winter, and noting how they seem to precede weather events down south, where I live in New Hampshire,  by roughly a week. The invasions seem to “nudge” the build-up of cold air off the Pole and down south through Canada, to the USA, where they make headlines. Two nudges ago brought us the Washington DC blizzard, and then that snow swiftly melted away as the nudging ceased and the cold built at the Pole. Then a smaller nudge sent another outbreak south, but it was strong for such a little nudge, and set records for cold even though it was brief. Now it is warm again, reflecting the last period the cold was building up at the Pole, and I’m expecting another outbreak a week from now, due to the current nudge.

Looking at a Dr. Ryan Maue map (from the Weatherbell Site) of temperatures three days from now (Canadian JEM model) you can see the bright pink in northern Canada, indicative of temperatures down at minus 40, (that great temperature where Fahrenheit and Celsius finally agree).

AAA1 cmc_t2m_noram_13

The surface map for that time (three days from now) shows an interesting low over northern Hudson Bay, and the north winds on its west side seem likely to shift that very cold air south towards me. I don’t imagine it will warm much as it comes south, for it will be passing over snow-covered landscapes, and the nights are still longer than the days.

AAA2 cmc_mslp_uv10m_noram_13

A look down from the top of the planet five days from now sees that low still parked over Hudson Bay, and a new low north of Greenland. In fact the high pressure over Greenland seems totally surrounded by storms.

AAA3 cmc_mslp_uv10m_arctic_17

What is especially interesting is that the temperature map five days from now shows that, despite the invasion of milder air over the Pole, major cold remains over both north Canada and Siberia. The imported mildness is being squandered, lost to outer space, without warming the tundra much, though perhaps it is nudging that tundra’s cold south to places where it is unwanted by the old, and enjoyed by the young.

AAA4 cmc_t2m_arctic_17

The invasion is causing the temperatures-north-of-eighty-degrees-latitude graph to show warming.DMI3 0217 meanT_2016

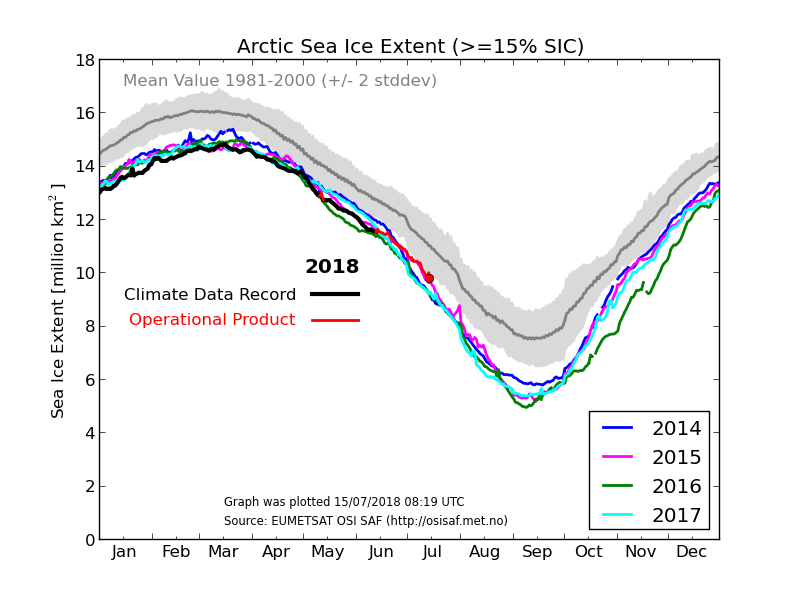
I would expect the invasion from the Atlantic to compress the sea-ice to the north, decreasing the extent of the ice, but so far the extent-graph shows a slow rise.DMI3 0217 icecover_current_new (1)With storminess increasing at the Pole, it will be interesting to watch the NRL map of how the ice is moving. Currently it is describing the shape of the elongated high pressure, and the ice is staying put in the Arctic Ocean, with little being flushed out. AAA5 arcticicespddrfnowcastThe above map shows fast-moving ice crashing into slower ice north of the Mackenzie River Delta, likely building pressure ridges, while some leads are opening up north of Bering Strait, where faster-moving ice accelerates away from slower ice. A lot of shifting and crunching is likely to occur over the next week, and I am going to try to post more of these maps that show how the ice moves. They clearly show how mobile the ice is, and refute the idea that sea-ice is static stuff that is only effected by Global Warming.

O-BUOY 8b BITES THE DUST?

I never like to see one of the Arctic buoys go through a blank period, when reporting data:Obuoy 8b 0218 temperature-1weekIt is especially troubling in the case of O-buoy 8b, because it is located right where the ice seems stressed, in the above ice-motion map. Also it located right on the edge of a sort of San Andres Fault, formed within hours of when the bouy was placed last fall. If you have two minutes to spare, it is well worth watching the time lapse movie made of pictures taken by the O-buoy 8b camera last fall.  Among other things, it shows within an hour of the men working to place the camera on the ice, the ice cracked up.

http://obuoy.datatransport.org/monitor#buoy8/movie

This does make one think about the risk the men take, installing those cameras when the ice is weak in September. (Not to mention the chance of meeting a 1500 pound bear.) It also makes me wonder if the icebreakers they ride up there on actually weaken the ice, and cause a sort of structural failure of areas greater than the channel made by the boat itself. (I know it works that way when they break up the ice in harbors in the spring.) Here is a picture of the Mass Balance Buoiy 2015 right after it was placed last August.  (Note the vanity of the graffiti. Seems odd that fame is seen in having your name appear where it is likely only a polar bear will ever see it.)Install 2015F_signaturesAnd here is a picture of Obuoy 13 after it was placed.Obuoy 13 2015JNote the solar panels, which may explain why there are no pictures after the sun sets for the winter. The GPS must have a separate battery.

Sometimes these buoys come to life after surprisingly long periods of time off the air. One came back last summer after more than a month. Perhaps they get tilted, and can’t properly transmit. Also I read there can be times they can’t get room because other projects are using the available space on the Satellite they must all share, when transmitting. In such cases the buoy has the ability to save data and send it later.

I hope we see O-buoy 8b come back soon.

FRIDAY NIGHT UPDATE

Despite the steady import of milder Atlantic air up over the Pole, the cold continues to build in northern Canada.  Also a lot of the “nudged” air spilled down the east coast of Greenland and is chilling the north Atlantic, cooling the western shores of Europe. Joseph D’Aleo has an interesting post on his blog at the Weatherbell site about the possibility of late-season snows in Europe. I can’t claim I saw that cold air sneaking around from the northwest, as usually the Atlantic moderates the arctic air, but it sure looks like the western coasts of Europe are cooling. Their midwinter surge of mildness seems to be flipping. In fact I think this winter will wind up being remembered for a lot of flip flops in both Europe and North America. Europe has been spared the steady blasting of Siberian cold China has gotten, (and that I remember too well happening here last winter). (Personally I mind winter a lot less when it is served out in small helpings.)Whip 1 ncep_cfsv2_28_t2anom_europe__1_(23)The DMI maps show the cross-polar-flow swinging from Siberia-to-Canada to Scandinavia-to-Alaska, but the milder air continues to flow over the Pole. It cools fairly dramatically as it approaches Canada, partly because there is still no sun close to the Pole, and partly because the air rises and doesn’t show on surface maps. Because the air is rising we are expecting low pressure to appear north of Greenland.

The winds pushing the ice back towards the Pole is finally showing a reduction of ice-extent on the extent graph. DMI3 0219B icecover_current_new (1)I confess I’m nervous about the extent being low. If it is a “record” low the hubbub of the Alarmists will be hard to bear. They will fail to mention that the mildness up towards the Pole meant the arctic air was displaced, and places like Mexico and Saudi Arabia and Thailand saw “unprecedented” cold this winter (which I documented). Though I mention the mild places, on this site, they are sort of color blind, or “cold blind”, and on their sites they won’t mention the suffering of the refugees in Syria and south Turkey. Instead they’ll start the tiresome “Death Spiral” malarkey all over again, and will wait in breathless anticipation of an ice-free Pole this summer, and suffer depression when it doesn’t happen.

The only gleam of hope I have is that the “displacement”, (more properly called “nudging”), looks like it will continue, and we could see some late season snows. There is nothing like snows in April to hush most Alarmists, (though the worst will claim most anything proves their point).

Not that I much want to see late season snows in my own backyard. I’m NIMBY when it comes to winter weather, these days. However the flip-flopping between mild and arctic does seem to bring together the ingredients that bake the cake of big storms. Last winter, once we got stuck in a frigid pattern, it stayed pretty dry. We were four inches of snow away from setting an all-time record for snow all over New England, in Early February, and then the final four inches didn’t seem to want to come. Maybe people were so sick of shoveling snow that they resorted to prayer. That is unscientific, and is among the powers (such as water vapor) that some models fail to include. In any case, we did break the record, just barely, in the end, but it was a close call. It was like Old Man Winter had us staggering, but never hit us with the knock-out punch. The old grouch has a kind side. Who knew?

Around here the real “knock out punch” happened the year my mother’s mother was born, and is called “The Blizzard Of 1888”. It had 4 feet of snow, drifts over 2 story houses, and 80-mile-an-hour winds, around here, (though Boston got a lot of slush), and one thing the old reports mention is that it happened after a fairly mild and snow-free winter. So, if you are inclined to worry, that gives you a reason to worry if the winter is kind. Me? I’m just enjoying the present mild spell.

That blizzard started out as light rain, with temperatures mild. Then the storm exploded and stalled, just southeast of New York City, and temperatures crashed. The ingredients for that storm seemed to be flip flopping patterns, which brought very mild and juicy air right against very cold arctic air.  Of course, other things were involved as well, but I’m expecting those “other things” to get lined up somewhere, the next sixty days, and create a whopper storm.

In yesterday’s post Joseph D’Aleo pulled out a brilliant trick he has, involving using the experience of the past to see the likelihood of current weather being warm or cold, or wet or dry. The trick (or part of it) starts with this map, which shows whether ocean temperatures are above normal or below normal:Flip 2 globe_cdas1_anom(70)Most people immediately look at the above map and focus in on the hot spot in the center of the Equatorial Pacific. That is the El Nino there has been much fuss about, and it is actually fading very swiftly, especially towards South America. Because the El Nino is now away from South America and towards the Dateline, it now qualifies as an El Nino Modoki. That has different effects than an El Nino sitting right on the coast of South America. The genius of Joseph D’Aleo is that he goes through all the past maps of other El Nono Modoki situations, and combines them into a sort of blended average. For my neck of the woods, such an average suggests I’ll experience a cold late-winter.

But the Equatorial Pacific  is not the only part of the planet.  D’Aleo does the same thing for other parts of the planet. For example, in the above map you will notice there are cool pools in both the North Pacific and North Atlantic. What sort of blended averages do they give?

And that’s where it gets interesting, because they totally disagree with each other. The cool pool over the North Pacific is saying temperatures should be like this over North America (which would be cold for me.)Flip 3 COLD_NW_HI_MARBut the cool pool in the North Atlantic states this is likely (which would be warmer for me).Flip 4 NE_ATL_COLD_MAR(1)What a contradiction! My guess is that, (because we cannot see both), we will see a flip-flopping clash, which may create the meetings of mild and cold that creates historic storms.

However there is another lesson to be learned in this. It is this: You must be broad-minded. If one only looked at the Pacific, or only looked at the Atlantic, one would obviously miss the big picture. In like manner old coots like me must not only look at how high hornets build their nests, or only look at how fat the deer are, or only count the black sections of woolly bear caterpillars.

This is what drives me nuts about Alarmists, who only look at the levels of CO2. How can they be so insanely narrow-minded?

Due to health concerns I’ve been thinking a bit about my latter end, and what I might say, if it turns out we actually do stand before God and answer some Fatherly questions after we die. I think I’m going to be in trouble,  if I have to answer questions about how I treated ridiculous, narrow-minded Alarmists. I wish I could proudly stand before the Lord and announce I’d been charitable, and had patiently explained all the things Alarmists were not permitting past the blinders which they so willingly wear. I wish I could even say I stomped around and kicked the wall and said nothing. Instead I fear that, when asked how I responded to pitiable people, I will have to confess that I barfed.

In any case, I do not expect the current calm conditions to last.

MONDAY MORNING UPDATE

The relatively mild (but below freezing) Atlantic air moving up over the Pole has supplied the uplift, because warm air rises, to create a relatively meek low pressure up over the Pole. This will interrupt the flow of Atlantic air, and likely lead to lowering temperatures, especially if the the low fills and weakens.  The flow over Barents Sea will continue from the south, which will continue to compress the sea-ice north, and keep the ice-extent graph low.

OBSERVATION ABOUT LAPTEV SEA SEA-ICE

The Laptev Sea is a great exporter of ice, due to winds roaring off shore from the depths of Siberia. Even in the dead of winter there can be polynyas of open water along the shore, as the ice is shoved out to sea, towards the Pole and eventually to crunch up against the Canadian Archipelago and Northern Greenland, which are great importers of sea-ice.

There is considerable variety in the amounts of ice exported from the Laptev Sea, and this winter has seen much less ice be exported. Perhaps this is because a lot of the Siberian cold was pushed south into China, rather than coming north. In any case, the ice is much thicker than last year in the Laptev Sea, and also parts of the East Siberian Sea. We are talking three or four or even five feet thicker, in places. This will not show up in the extent graph, which does not care is ice is six feet or six inches thick. However it is something to keep in mind, as the ice melts this summer.

Ice in other places will be missing the reinforcements of Laptev ice, but the Laptev Sea itself may be slower to melt unless, of course, some late winter howling winds push all its ice off shore.

Thickness 20160217 arcticictnowcastOne interesting bit of trivia involves the island of thicker ice to the northeast of Wrangle Island. That was, late last summer, part of the “reef” which formed the southern boundary of the “Slot” of open water north of Alaska, and before that it was a sort of long and thin bulldozed pressure ridge towards the western Canadian Archipelago, formed as the multi-year ice plowed ahead through “baby ice”,  and at one point it was roughly fifteen feet thick (dark red in the above map.) It is amazing the changes ice goes through, even when it retains a sort of identity.

CONCLUSION —Surprise! Nudge didn’t come south—

One thing you have to be ready for when watching the sea-ice is to be wrong. I’ve actually attempted to avoid ever expecting anything, to avoid ever being wrong, but the mind simply  doesn’t seem to work that way. It notices patterns, and once you notice a pattern you expect it to happen again. Sometimes it does, and sometimes you are in for a surprise. Therefore I think I’ll  stop using the word “wrong” and start using the word “surprised”.

In any case, rather than hiding the evidence I’ll conclude this post with what surprised me. The DMI maps show a push of milder air up over the Pole, but what surprised me was that the cold air over the Pole didn’t come charging down into the USA, but rather was swept southeast and then east into the Atlantic,  south of Greenland.  Some cold air did leak south into the west of the USA, but a major storm blew up in the middle of the country, bringing very mild air up  the east coast. Therefore I was awoken by flashing lightning and loud thunder after midnight last night, with temperatures up near sixty right at a time I was expecting an arctic outbreak, when I looked ahead last week. Surprise! (And actually it is a sort of pleasant surprise, as there is nothing to  shovel.)

Here are the concluding DMI maps.

The low stalled over Scandinavia looks like  it will cut off the flow of Atlantic air over the Pole, and actually export air down over the Atlantic. That air, likely combined with the cold air being exported from Canada south of Greenland, ought give Western Europe the coldest sort of Atlantic air it ever gets.  Meanwhile the drained Pole can start growing a new pool of cold.

Below are The Dr. Ryan Maue maps from Weatherbell  showing the GFS model initial run of temperatures for this morning, and then temperatures for 2 days from now. You can see some of the cold does make it down to the eastern USA (so I could claim my nudge-theory was “right”, if I wanted to spoil the surprise), however you can also see the core of the cold is hooking east towards Labrador and the Atlantic.

Surprise 1 gfs_t2m_noram_1Surprise 2 gfs_t2m_noram_9And of course we need a map of the surprise storm roaring up west of here, giving the Great Lakes a pretty good blizzard, as we get a mild night and thunder like it is summer.20160225 satsfc20160225 rad_nat_640x480As interesting as midnight thunder may be for me, it likely belongs more in a “Local View” post, and I should turn my eyes to Europe, and the waters north of there. Europe had a chilly dawn, though the air seems Atlantic, rather than east winds from Siberia. (pink is below freezing.)Surprise 3 gfs_t2m_eur_1To the north the winds have shifted around to the north in Barents Sea, which may be spreading ice south rather than compressing it north, and explain (at least partially) the odd little up-tick in the ice-extent graph.DMI3 0225 icecover_current_new (1)For the most part winds have been south in Barents Sea this winter, and the Pole has been invaded by Atlantic air, making it above normal all winter up there. DMI3 0225 meanT_2016Barents Sea is pretty much wide open, and has been through a complete flip-flop over the past two years. I have the sense it is trying to  show us something, but we mortals are too dense to get it. In any case, I think  it will be the focus of my next sea-ice post.