SOMETHING FISHY

A truism we are often made uncomfortable by is that, in order to build up, we often have to take down. We are comfortable with God as a creator, or sustainer, but less comfortable with God as the “dissolver” (which I prefer to “destroyer”.) However, in the end, our mortal lives do come to an end. We do get dissolved. It is part of the process, and it is best to have a good attitude about the inevitable, like the old Blood Sweat and Tears song, “…when I’m gone there’ll be one child born to carry on.”

As a student of history, I get to see across the expanse of time and watch how nations rise and fall. One develops a sort of detachment. One cannot participate too deeply in the thrill of victory and agony of defeat, because one will lose their objectivity. And, objectively speaking, many of the primary figures in history come across as very subjective, even to a degree of being buffoons. They relish the thrill of victory as they rise and agonize about the agony of defeat as they fall, and seldom have the humbleness that knows that when they are gone one little child will replace them. “What!” they exclaim. “I am irreplaceable!”

Well, I suppose it is true one is irreplicable. But so is everyone else. We are each as unique as our fingerprint, but the Creator is so creative He easily can replace the irreplaceable with the equally irreplaceable. Assyrians were replaced by Babylonians who were replaced by Persians who were replaced by Greeks who were replaced by Romans. Each were beautiful when they sprouted and budded and bloomed, and worth sustaining as they fruited, but worth pruning when they became unproductive.

A historian attempts to step back and be objective, and not to get too sucked into the affray we call “current events”. A true historian even doesn’t care about the current event called “getting paid”. He will insult his sponsors and be fired from his job, because he sees a higher truth.

It is helpful to be a poet, because then no one is paying you to begin with. You don’t have to worry about losing your position at a university, unless they hire you as a dishwasher.

As a poet I’d like to chat about a news item in the papers almost exactly a century ago, regarding fish. The paper was the Washington Times, and the date was June 6, 1922. It contained this map:

There is something fishy about this map. How is it even possible? They had no satellites in 1922. Likely they had no airplanes. It was five years before Charles Lindbergh became the first to fly across the Atlantic in 1927. Did the reporter just make it up?

Judging from the article, the reporter did consult Adolf Hoel, proffeser of geology at the University of Christiana. Perhaps Adolf sketched the map on a napkin as they chatted in a Cafe. But how did Adolf gather such data?

The reporter goes on to mention a wise old fisherman, who had sailed the waters 54 years, Captain Martin Ingarbrigtsen. Perhaps his experience contributed to the above map. The fisherman was a primary source of data for the U.S. consul at Bremin, Norway, Mr. Iffey, who relayed the information to the U.S. Department of Commerce.

What is refreshing about all this is that there is no Global Warming crap involved. There is no narrative. There is no agenda. There is no bias. There are just honest men relaying information about an interesting and perhaps extraordinary change. And what was the change?

The 1922 article states, “Formerly vast shoals of whitefish were found about Spitzbergen, but last summer fishermen sought them in vain.” Later the article states, “On the other hand, other kinds of fishes, hitherto unknown so far north, have made their appearance. Shoals of smelt have arrived, and immense schools of herring are reported by fishermen off the west coast of Spitzbergen.”

This 100-year-old data has importance to all who want to increase the amount of fish we can harvest from the sea, without overfishing. We need to differentiate rises and falls in fish populations that are natural, caused by swings of natural cycles, from those caused by overfishing, or by altering the fishes environment by reducing coastal marshes and rivers, or by destroying the sea-bottom with dragging nets.

For example, we are actually reducing our supply of protein when we “reclaim” ocean marshes to grow grain, for those marshes are so vital to the life cycle of fish that for every pound of protein we gain from grain or rice we lose ten pounds of protein we might have had from fish. Often draining marshes is not a case of robbing Peter to pay Paul; it is a case of killing the goose that laid the golden egg.

It is hard to see a smelly marsh might be better than manmade dikes and landscapes like Holland’s, and the only way to overcome such difficulty is through honestly reporting the facts.

The United States has perhaps gone too far, when it comes to “protecting wetlands”, but it has good advice to offer China about the dangerous prospect of destroying the fisheries of the Yellow Sea by developing the wide wetlands along its coast. It is a situation where China could starve its people by growing more rice.

However, in order to understand changes man causes, we must understand the changes nature causes, without any help from man.

The 1922 article may be indulging in a bit of sensationalism, for papers were guilty of that even back then, but basically, its report is describing what we now know, that they didn’t know then: The antics of the WSC (West Spitzbergen Current) can drastically change conditions, by changing where it stops being a surface current and instead becomes subsurface current. The 1922 article describes summer water temperatures switching from 5 degrees above freezing to 28 degrees above freezing.

This would explain the way sea-ice disappears, in the above map, especially along the route the WSC takes to Svalbard. It would be incidental data, from before the age of satellites.

What is most fishy is how Alarmists loathe such data and want to blot it from the record. My guess is that it spoils their narrative. They want to show current melting has never been seen before. But it has happened. It happened in 1922, and many times before. And the sea-ice must also return, over and over, for it to happen, over and over.

In 1922 the article sensationalizes the fact fishermen could sail to the north coast of Svalbard and even to Raudfjorden, but the fact of the matter is that bay was first mapped by Willem Barents in 1496. History seems to show the sea-ice comes and the sea-ice goes.

Why are Alarmists so threatened by history? God creates sea-ice, sustains sea-ice, and dissolves sea-ice. It is a cycle.

Perhaps they find it fishy. It suggests that they too are part of a cycle. They are part of a process, and were given power by God, saw power sustained a while by God, but, like the Assyrians, the Babylonians, the Persians, the Greeks, the Romans, and even little, old me, will soon face a day when power is dissolved by God.

ARCTIC SEA ICE –Chicken Little Alert–

(This post was written in late October).

This will hopefully be a brief post, because I’m striving to avoid the Big Lie. What is the Big Lie? It is all the balderdash about Global Warming. Fraudulent Biden is off to Europe to blather about a crisis which doesn’t exist, and, because it doesn’t exist, it seems I might miss beauty which does exist, if I involve myself in arguments about political nonsense. So let me begin by skipping paragraphs and paragraphs and paragraphs.

Beauty that does exist is the Truth, and Truth is always beautiful and always addictively engrossing, (even if it tends to demolish a pet theory or ten of my own).

What has recently happened at the Pole involved a surprising increase in the “extent” of sea-ice. There was basically 20% more sea-ice this October than there was last year. By October 25 last year we had barely reached 6 million km2 of “extent”, while this year we soared up towards 9 million.

To people caught up in politics, this increase might sidetrack them into discussions about whether the sea-ice is shrinking or growing, but I tend to be more interested in what it means for my little farm, in an obscure nook of New Hampshire.

In terms of a warm winter, it doesn’t look good. Why? Because the “source regions” for our cold winters are places far away. Although they are far away, they (as source-regions) obey the same rules as close places do. And one rule is that it is more pleasant to live by water free of sea-ice than to live by an ice-bound coast. For example, southern Ireland is at the same latitude as southern Hudson Bay, but most people prefer the climate of Dublin to the climate of Churchill. They vote with their feet, and millions live by Dublin while the population of Churchill (in 2016) was 899.

As a farmer here in New Hampshire, I am not like the Irish of Dublin who can almost always depend on the Gulf Stream Waters of the Atlantic to keep their shores ice-free (unless it is 1817). Instead, here in New Hampshire, much of the Gulf Stream’s warmth is whisked away east to Ireland. Although we occasionally get midwinter warmth on southeast winds, we also look north and west to waters which might warm us, if they remain ice-free. The three bodies of water which, when they remain ice-free, spare us the onslaughts of the arctic, are the Great Lakes, Hudson Bay, and (oddly) the East Siberian Sea.

In terms of the Great Lakes, savagely cold winds can be headed right towards my farm, but are tamed by the passage over the lakes. As the cold winds pass over the summer-warmed waters, clouds billow up and villages by the lakes can have snowfalls measured in feet. But by the time that artic blast gets to New England, it at best holds a few flakes, and has been so warmed that we wonder why anyone ever called it an “arctic blast”. As long as those lakes remain ice-free, we are protected.

Besides the Great Lakes most focus on, (Superior, Huron, Michigan, Erie, and Ontario) there are equally “great” lakes further north, (Winnipeg, Great Slave, Great Bear, and Athabasca.) Each year I watch as they first warm the arctic blasts with their water’s memory of summer warmth, and then lose that power as they freeze over. The northern lakes always freeze over, and the southern lakes seldom freeze entirely. However, during especially cold winters even the southern lakes may freeze (and even Niagara Falls may quit falling,) and on those winters our west winds become cruel. We cease being spared.

The same is true for Hudson Bay. As long as it is ice-free, the Pole can aim minus forty air straight towards us, but that air is so warmed by passing over Hudson Bay it is like we live in Ireland. Yet, nearly every year, the entire vastness of Hudson Bay flash-freezes over in late November and early December, and the moment Hudson Bay is ice-covered we know we are not living in Ireland. We then experience cold the Irish can’t imagine.

But the East Siberian Sea is so far away it seems ridiculous to suggest it can warm us. But I suspect it can. After all, the coldest air the northern hemisphere creates is created over Siberia, and, in order to get to my farm, it must first pass over the East Siberian Sea.

Last October those waters were open.

This year they were ice-covered.

Siberian cold which was moderated last year, by transiting ice-free waters, this year has not been moderated. The question then becomes, is that air headed my way? This is determined by whether the flow is “zonal” or “meridional”. A zonal flow tends to move straight along lines of latitude, and the coldest air stays north. A meridional flow involves the jet stream looping far north and then far south, bringing warmth north and arctic blasts south.

One of the coldest winters I recall was 1976-1977’s, and featured blast after blast of arctic air crossing north of Bering Strait and, even as much of southern and western Alaska experienced a mild winter, curving down through Yukon and down the east slopes of the Rocky Mountains to the eastern United States. On the maps it looked like a long series of “Alberta Clippers”, with each one delivering another packet of Siberian air. The cold set in early in November and lasted into February. In Maine I was able to walk sea-ice from South Freeport across Casco Bay to Harpswell, and Time Magazine featured a sensationalist cover warning of a coming Ice Age.

The coldest December I recall was 1989’s, which caught my attention because the local road crew was digging a trench with a backhoe near my house, and as the month passed the backhoe had to break through a thicker and thicker crust of frozen earth. At the start of the month the frozen earth was only a few inches thick, but by the end of the month they had to fight through a crust more than three feet thick as they completed the job. It wasn’t a well-done job, as the trench was refilled with big chunks of frozen earth, which held air spaces so that when the earth melted in the spring the road became uneven and a bit of a roller coaster. But one thing I recall about that winter was that the cold broke as if the sky was paying attention to the calendar, and after a December which had people bracing for a terrible winter, a change occurred, and, beginning promptly on January 1, the rest of the winter was surprisingly meek. The pattern changed, and the Siberian air went elsewhere.

This variability is one of the wonders of watching the weather. The better long-range forecasters have skulls holding the memories of thousands of maps, which they use as analogs that state, “if A, then B is likely to follow.” But they stress that word “likely”. They are very aware uncertainty is involved, and always have an eye out for the “unlikely”. The moment they notice the weather is not following the expected path their brains ruffle through thousands of other maps, seeking other times the weather deviated from the norm and took a different path. Often the best forecast is a correction, and the trick is to be ahead of the game and to be the first to recognize the earlier forecast was wrong. It does not pay, when dealing with the wonders of weather, to be too stubborn and set in your ways. (At this point I could be drawn off into arguments about whether the politics of Global Warming involves being stuck on a particular wrong forecast, but I don’t want to go there; I prefer the beauty of Truth, and the wonder.)

I like to watch good forecasters at work, drawing upon their experience to prepare their forecasts. Back when I was young, before computers were used by weathermen, I used to switch between three or four forecasters on TV channels four, five, seven and nine in Boston, because there could be considerable variety in the forecasts, and there was a lively competition between the meteorologists to “get it right.” (I was dismayed when I later moved to a part of the country where the weather was more boring, and the forecasters on TV tended to be voluptuous women who knew a lot about flirting but next to nothing about meteorology.)

Boston in the 1950’s and 1960’s was a great place to be, if you were a boy interested in the weather, for the public was concerned and deeply interested, and the market for meteorology provided money for innovations. The first Boston TV forecaster (before I was born) actually had a fifteen-minute show on the primitive TV sets of 1948. He was an MIT professor who smoked a pipe on air and scrawled on a blackboard, educating the public about things such as isobars, which many more ordinary newscasters knew zilch about. Forecasters who followed also would become very involved in educating the public, and at times annoyed the rest of the broadcast-team by pressing the limits of the time allotted to weather. I think some non-meteorologist reporters were downright jealous, for, in the same manner sports fans are very interested in obscure statistics of a sport they enjoy, and care more for the sports section of a newspaper than news others deem more important, the general public paid more attention to weathermen than to blathering politicians, or even sports reporters. But that made some sense. A baseball game doesn’t change the standard of living as much as a snowstorm does.

Perhaps due to the jealousy of other reporters, weathermen had to endure a lot on on-air jeering when their forecasts were wrong, but sometimes they’d see a big storm coming a week in advance, and it was wonderful watching their excitement grow, and their exhilaration when the storm actually happened as forecast. In particular I remember a forecaster named Bob Copeland who one winter got onto what a gambler might call a “hot streak” and went weeks predicting the weather with amazing accuracy, with his snowfall estimates correct to the inch, so that even the forecasters on other stations shook their heads. Though rivals, TV forecasters were also comrades, and met after work to compare notes. Misery loves company, and they all knew the misery of a botched forecast, a major storm that swerved out to sea and dumped a foot of snow on fishes, as all the inland forecasters got dumped on with laughing mockery.

The fact certain forecasters could experience “hot streaks” led me to wonder if something more than science was involved, for all the forecasters began with the same data, but arrived at different conclusions. Sadly, many modern forecasters seem to have lost some of that ability, (whatever it is), becoming overly dependent on computers, though computers can be equally wrong, especially in the long term. (At this point I could launch off into the foolishness of politics based on computer models, but again I won’t go there. It is far more fun to watch Truth unfold in real time than to squint at a future that very likely never will happen.)

I currently like the Weatherbell site because the forecasters seem more rooted in the ability of old-time forecasters, and explain what analogs they are using, and speak honestly in terms of likelihoods and probabilities, and never speak of science as being “settled.” This autumn they see a good probability of a cold December developing, using twelve years where a similar lead-ups all led to cold Decembers. What is interesting is that after sharing similar Decembers the paths of the twelve winters diverge, some relenting and becoming balmy, and others becoming winters of lasting cold.

Arctic sea-ice is but one component of many, when making such forecasts, but I like to focus on it, as it seems to have a definite influence on arctic air-masses, which later effect New Hampshire winters.

It has been interesting to watch how the recent low levels of sea-ice have led to the marginal seas around the edge of the Arctic Ocean becoming capable of holding greater warmth. As long as those seas have ice in their waters they are forced to remain the temperature of ice-water, but as soon as the ice is entirely melted those waters can warm with surprising speed under the twenty-four hour sunshine of summer. Then when, with equally surprising speed, the twenty-four-hour sunshine gives way to twenty-four-hour darkness, those marginal seas shift to giving back the summer warmth they absorbed. From September 21 to October 21 the 24-hour darkness expands from a dot at the Pole to a vast area extending a quarter of the way down the top of Greenland, and along that latitude clear around the Arctic Sea, but despite the absence of warming sunshine many areas remain above freezing, due to the “maritime influence” of summer-warmed seas. Meanwhile land far more swiftly loses heat and starts to generate cold. Where, in July, the land baked under 24 hour sunshine and was much warmer than the sea (tending to generate sea-breezes), by October the same land becomes colder than the sea (generating land-breezes.)

One aspect of the warming of the marginal seas involves how early they become ice-free. If they become ice-free early, in July or (if winds push ice offshore) even in June, the sun is relatively high in the arctic sky and can warm waters swiftly. But if the waters become ice-free in August the sun is lower and partially glances off the water. The heating swiftly diminishes as the sun sinks towards the horizon. In fact, if the seas become ice-free in September the sun is so low it nearly entirely bounces off the water, as the “albedo” of glassy sea-water is higher than that of dirty sea-ice when the sun is less than ten degrees above the horizon, and by September the open water of a marginal sea may actually be losing more heat than it gains.

In order to significantly alter the temperature of nearby landmasses, the marginal seas must become ice-free early, and soak up heat all summer. This may have been the situation during the Medieval Warm Period, and have led to marginal seas so warm they delayed the onset of winter, which enabled Vikings to farm places in Greenland we can’t farm any more.

But this past summer saw the marginal seas more clotted by ice than the year before, which leads one to wonder: “Why?” In many places the ice lingered well into August, and by the time it was gone it was too late for the sun to warm much. Consequently, the sea-ice was able to reform swiftly, as the above NRL maps show. But why did the sea-ice linger?

I’m not sure, but one factor was a shift in the movement of sea-ice. Ice which was more ordinarily flushed south through Fram Strait was retained. In fact, if Nansen had sailed the Fram last winter his ship would have drifted north right across the Pole, rather than taking its more southerly route closer to Eurasia.

Dotted line = planned route. Dashed lines = actual drift.

Also in fact, if the Polarstern had sailed last winter rather than the winter before, the MOSAiC expedition would have crossed the Pole, rather than following Nansen’s path. The sea-ice took a less usual route, though not an unprecedented route, (for Russian sea-ice bases sometimes were pulled away from Russia towards Canada, in the past). This uncommon flow is a sort of cancellation of the Transpolar Drift and an expansion of the Beaufort Gyre, and keeps sea-ice up in the arctic.

Also there was a change in the inflow of warm water into the Arctic. This was especially noticeable in the case of the WSC (West Spitsbergen Current), which brings warm waters up along the west coast of Svalbard. It can keep the west coast ice-free even in the dead of winter. In June of 1597, when ice melt had barely begun, Willem Barrentz was able to sail a primitive non-icebreaker along part of the north coast of Svalbard, due to this current’s power to melt sea-ice. Yet last summer it lost power. Sea-ice came down to the north shore of Svalbard and even down the west coast during the warmest time of year. Why?

I wonder. Two explanations have crossed my mind. One is that the north Atlantic storm track shifted, and the mega-gales exploded much further east than normal. Usually they explode over Iceland, and roaring southerly gales on their east side assist the WSC as it heads north. Last winter the mega-gales exploded north of Norway in Barents Sea, and roaring northerly winds on the west side pushed against the WSC, and also churned and chilled the WSC’s warmer and saltier waters.

A second event, purely theoretical at this point, is that the very power that draws warm waters north may have been meddled with.

Warm water is drawn north to replace cold water that is sinking. The cold water sinks because it is cold, and also because it is partially brine exuded from sea-ice as sea-ice forms (brine is heavier than sea water.) This cold, salty water exits the Arctic through the one deep channel available, in Fram Strait, and must be replaced by warm currents, including the WPC, at the surface. But what happens if the water does not descend?

This may have happened last summer due to a major sea-bottom eruption of lava well to the northeast of Svalbard. I hypothesize this event occurred due to an odd hole that appeared in the sea-ice for no apparent reason, and which remained a feature for roughly ninety days. If the hole had a volcanic origin, it would suggest waters were rising where they ordinarily sink. This would get in the way of what draws the WSC north. Is it sheer coincidence that right at this point the WSC seemed to stop flowing, and stopped melting sea-ice west of Svalbard, and sea-ice extended further south than usual? (Since then, the WSC has resumed its usual flow.)

If the WSC was in any way slowed, less warm water would enter the arctic for ninety days, which likely would result in less melting of sea-ice. (Much melt comes from below. In fact refreezing begins as early as August at the top, but ice-extent continues to decrease well into September, due to melting from below).

The possible derangement of the WSC is perhaps “unlikely”, but it is one of the variables smart weathermen note, when attempting to state what is “likely”. We are dealing with a Creation that includes numerous variables, for our Creator did not want us bored. There are so many variables some call it chaos, but it all fits together perfectly and creates the harmony of Creation. To the person midst a major hurricane chaos seems complete, but a satellite view shows all the countless variables have created a symmetrical pinwheel with an eye, neat and tidy and far from chaotic, (unless you redefine chaos.)

In any case, I simply note, with wonder, an increase in the extent of sea-ice, and add a few feeble attempts to explain it. I also am splitting wood like crazy, which is hard (but fun) for an old fossil like myself, because I figure Fraudulent Biden will have energy prices soaring up through the roof, and I soon will not be able to afford heating my home with fossil fuels.

I hope for the best. I hope the flow is zonal and the bitter cold rotates around the planet north of latitude seventy. This will increase sea-ice but leave me alone. However I prepare for the worst. I prepare as if the flow will become latitudinal, and air from East Siberia will cross north of Bering Strait, unwarmed by the ice-covered East Siberian marginal sea, and unwarmed by the swiftly ice-covered northern Canadian great lakes, and the swiftly ice-covered Hudson Bay, and the (perhaps) surprisingly ice-choked southern Great Lakes, and we get blasted by a winter like 1976-1977, or by a December like 1989’s.

As an old timer, I tend to think people have become soft. They were not around back then, and call zero (minus seventeen Celsius) cold when it happens a day or two during a winter. They haven’t experienced a winter when zero becomes the norm, and the colder days drop to minus 27 (minus 33 Celsius.) It is then that fossil fuels will no longer seem so politically incorrect. My experience is that at minus 27 all one wants to do is crank up the heat. However, the heat may not be available, because Fraudulent Biden pretends to fear the planet is getting too warm.

I am lucky because I am primitive, and am saving my oak and black locust for the possibility of severe cold. I save the high BTU wood for when it is needed. Right now I’m burning the trashy wood, the old punky stuff and the birch, poplar, alder and cherry. Then I’ll move on to the maple. Hopefully I’ll never need use the oak and black locust, and will wind up looking like a silly old man spooked by worries that never came to pass.

However here again I accent the humble admission that my forecast may be wrong. This makes me radically different from Fraudulent Biden, who seems insanely certain his forecasts are correct. He sails a ship of state he is so certain is unsinkable that he will punish any and all who disagree, because authorities assure him his ship is unsinkable. But didn’t the authorities state the Titanic was unsinkable?

It is occurring to some who formerly were all-in and sold-on political correctness that they may have been mistaken. This tends to occur when Truth interferes with belief. You are rushing around with a forecast of doom, feeling like you are Paul Revere awaking the sleeping public to an invasion of Redcoats, and then become aware you are Chicken Little, rushing about screeching the sky is falling.

In terms of Arctic sea-ice, this has happened the past year. A year ago, at one point in October, the “extent” of sea-ice briefly rose more slowly than it did in 2012, and during that brief time 2020 had the lowest sea-ice “extent” ever for that date. (“Ever” being the recent past, barely sixty years, when relatively accurate records have been possible.) At that point it was understandable that an Alarmist could feel like Paul Revere. But now, they feel like Chicken Little. For, rather than melting away as forecast, the sea-ice has increased by 20%, and perhaps even more. Truth has spoken.

We all make mistakes. We all are incorrect. It is the human condition. And making mistakes can even be a good thing, if we confess we are mistaken. Mistakes teach us. Mistakes can improve us. But only if we confess they were mistakes. If we insist we are right when we are obviously not, our egos are tricking us into disaster.

Alarmists who were convinced the sea-ice was melting away are now not only confronted by the fact the sea-ice has increased by 20%, but by two responses to the event. On one hand they see people like me, who wonder, and ask questions, and share observations. And on the other hand they see people who insist sea-ice is decreasing even when it isn’t.

They then start to notice the same people insist polar bears are becoming extinct, when the population of polar bears has increased, (perhaps even doubled), over the past sixty years.

It even starts to occur to them that political correctness is incorrect. To such a person I can only say, “Welcome to my world.”

But, as I stated earlier, I don’t really want to go there. Maybe in some future post I will bore everyone to tears with philosophical ramblings about the difference between political correctness and Truth, but for now I find that a sort of distraction. It is better to face facts, and do what seems best.

At the moment arguing with intellectuals will not keep me warm this coming winter. However being a non-intellectual who splits firewood will keep me warm. They say firewood warms you twice, at first with exercise, and only later by burning. So I likely will not post much, until I am sure I can sit by a warm stove until spring. Then I will post your ears off.

*******

P.S. I apologize for the delay in posting. I have been dealing with the slow decline of my laptop’s ability to function, due to all sorts of invasive stuff running in the background. Finally, I broke down and bought a new laptop. However, I don’t want to get the new one up and running without the help of a computer geek far smarter than I, who will install protection from invasive programs. Hopefully I soon will be posting more often.

My next sea-ice post will be about the “Dark Quarter”. If you divide the year into 4 quarters, 91.25 days long (not including leap years), the darkest days begin around November 5 and end around February 5. It is a time the sun offers least, when days are shortest and nights are longest, and a huge amount of heat is lost to outer space in the north. Without the sun, the only thing left to battle the cold is the heat retained in waters, and subtropical airmasses brought north by a meridional jet stream, (and sometimes rare heat brought about by the lava of volcanoes). Largely such sources cannot overcome the penetrating cold of the Dark Quarter. Sea-ice expands southward and thickens in the north. But that is stuff that happens every year, rather ho-hum, and it can’t explain the dramatic shifts in the amounts of sea-ice history reports.

What is perhaps more significant is the drift of the ice. Does it stay in the arctic or is it flushed south? Also significant are currents such as the WSC. Are they vigorous or feeble? (But CO2? It doesn’t really matter at all, but I will try to avoid that political quicksand, and merely marvel at the Truth).

Last year the East Siberian marginal sea froze over swiftly in early November, and the difference between last year’s “open water” and this year’s “ice-covered sea” vanished. The question then becomes, “Did the fact the East Siberian Sea become ice-covered earlier change things?”

Obviously it would. But I cannot identify the changes. I imagine it would allow more cold to develop, earlier, but where those airmasses went, I cannot say. They didn’t come down here. October in New Hampshire was balmy, though it was so wet the pastures squelched as you walked across them.

Plenty of room for wonder.

ARCTIC SEA-ICE –May Gale Blasts MOSAiC Expedition–

The past winter saw a surprising number of powerful lows cross Barents Sea into Kara Sea, with the north winds behind these gales pulling sea-ice south around Svalbard. The most recent gale took a more traditional route, hooking back west in a retrograde manner and passing right over Svalbard.

The MOSAiC Expedition, in the sea-ice about a third of the way to the Pole from Svalbard, experienced winds of 83 km/hr north of the gale, as the sea-ice accelerated from a nearly stationary drift to a drift  of over a kilometer an hour for a while. The bow-radar on the Polarstern showed a lead open and close, but not a great break-up of sea-ice. The sea-ice, which had been showing a slow drift southeast, was jerked west-southwest.

The MOSAiC Expedition, north of all the Barent Sea storms, has seen sea-ice in the Transpolar Drift move about twice as fast as usual. The hook to the southeast  was unusual, and perpendicular to the drift the Fram saw, New Years to Mayday, in 1896.

MOSAiC May 1 fsVIrgp

The recent jerk to the west-southwest is more in line with the Fram’s Track. It will be interesting to study the condition of the sea-ice, once the weather clears and the satellite view improves. Currently it looks like the gale tore the sea-ice from the north coast of Svalbard.

Svalbard May 13 Screenshot_2020-05-14 arctic io - Daily Satellite Images + Observations, 4-N90-E0(1)

What I wonder about is how much the sea-ice was compressed between Svalbard and the MOSAiC expedition. The Polarstern is suppose to head south towards Svalbard to be resupplied, and what they desire for such a journey is leads, and not pressure ridges.

There is an excellent video of part of the Russian icebreaker Kapitan Dranitsyn”s trip south from the MOSAiC site to port, showing how it has to back up and then ram to get through even ordinary sea-ice, yet has a far easier time once it finds leads skimmed with baby-ice.

In all, the journey of the Kapitan Dranitsyn from the MOSAiC site to port took three and a half weeks. The ship made it about halfway back to port in the thick sea-ice, and then was met by the Russian icebreaker Admiral Makarov, that refueled it. I think it took four days to complete the refueling. They then proceeded to the edge of the sea-ice in Barents Sea, but had to wait before venturing out into the open water because a gale was raging and the seas were too high. (I guess icebreakers are not designed for ocean storms.) They had to wait a week for the waves to subside under fifteen feet, but the MOSAiC scientists aboard got to observe how sea-ice fractures under the duress of huge swells. When the gale subsided they rushed across Barents Sea and two days later safely arrived in Tromso. (Likely some of the scientists had further adventures getting back to their home countries through the travel-bans of the Pandemic.)

It will be interesting to see what the Polarstern experiences, heading south.

The storm brought milder air over the arctic sea, including the year’s first patch of above-freezing air north of the Laptev Sea.

DMI meanT_2020 290513

The sea-ice “extent graph” shows the typical decline for this time of recent years:AAA DMI 020513 osisaf_nh_iceextent_daily_5years_en

Interestingly, the “volume” graph hasn’t fallen much, suggesting much of the sea-ice lost on the “extent” graph is baby-ice at the periphery, without much bulk to it.

DMI Volume 200513 Screenshot_2020-05-14 FullSize_CICE_combine_thick_SM_EN_20200513 png (PNG Image, 1337 × 1113 pixels)

Stay tuned.


ARCTIC SEA-ICE –Shift in the Drift–

Last post I talked about my yearning to see the Russian records of how the sea-ice drifted, in the cases of their 41 Arctic Ocean Bases, going all the way back to  1937, (as well as the 14 Barneo floating tourist-traps for the ober-wealthy, since 2002.).  Unfortunately such information is in some ways “top secret”, (in terms of industrial espionage, if not military). Because of this hidden record-keeping some shifts in the flow of sea-ice are described as “unprecedented” when in fact they have been seen before. The Russians themselves described two general flows of the sea-ice, translated as “circular” and “wash out”, yet the more political side of NOAA made a big deal of a change in the flow during the very-low-sea-ice year of 2012:

If that shift-in-the-drift was a sure sign of Global Warming, as certain Alarmists suggested when the above video was published in 2012, then surely the shift-in-the-drift away from that pattern to what we see now must refute Global Warming. Except it doesn’t. Alarmists either have very short attention spans, or have such overpowering confirmation-bias they’re blinded, or perhaps both.

The current drift is shown by the movement of the Polarstern and MOSAiC expedition, and is quite like the movement of Nansen’s ship “Fram” 130 years  earlier. (Blue line is the Fram after it was lodged in sea-ice).

https://upload.wikimedia.org/wikipedia/commons/thumb/e/ef/Nansen_Fram_Map.png/350px-Nansen_Fram_Map.png

This similarity is a little embarrassing for Alarmists, (especially when NOAA was stating currents had dramatically changed, only eight years ago). Fortunately for Alarmists, the Polarstern is moving much faster than the Fram did, and likely will cross a similar distance in perhaps only a third of the time it took the Fram. This can be used to suggest that the sea-ice is more “rotten” and that there is less of it, which may well be the case. (Although it may also be that the Polarstern is in the middle of the Transpolar Drift, while the Fram was closer to the Eurasian coast and may have been slowed by a counter-current which runs close to the coast.)

I tend to look about for other reasons the sea-ice may have been thicker in Nansen’s time. One thing that many have noticed is that the sun was “quieter” back then, if you look over the previous five decades. Nansen sailed the Fram at the end of sunspot cycle 13.

The very high sunspot totals (and low number of “spotless” days) of cycles 18 through 23 represent a time our Sun was quite energetic and pouring extra heat on the planet. Though we are now returning to quiet conditions, the arctic is currently still cooling from the warmer times which are called “The Modern Maximum”.  In Nansen’s day, however, the arctic was warming. In fact the high totals of “spotless days” before Nansen sailed are likely not as impressive as they look in the above graph, when you compare the above upward blip with the greater Dalton Minimum which preceded it, and the Dalton was preceded by the Maunder Minimum which is even more impressive. As measured by Carbon 14 in tree rings,  the energy of the “Modern Maximum” is especially impressive. (The graph below ends with the year 1950.)

I can’t help but wonder if Nansen and the Fram were sailing in an Arctic Ocean which “remembered” far colder times, whereas the MOSAiC scientists and the Polarstern are sailing in an Arctic Ocean which “remembers” warmer times, though those warmer times are now over.

Therefore I have a confirmation bias all my own. I am keeping a sharp look-out for changes which shift away from the lower ice-extents of the present to the higher extents of the past. For there can be little doubt the sun has gone quiet.

(Above from Joseph D’Leo’s blog on the Weatherbell Site.)

As my confirmation-bias looks for increases in sea-ice I often see the exact opposite of what I expect, because my thinking is too simplistic. Some of the ways the planet responds to a “quieter” sun are not what you would expect, and are counter-intuitive. Here are two I’ve mentioned in past posts:

First, you’d think less energy from the sun would make air colder and therefore drier, but instead the air gets warmer and moister, because the surface of the sea is warmer and more moisture evaporates. How can this be? I think this occurs because less energy from the sun also makes the winds less, and without strong Trade Winds the very cold waters can’t up-well along west-facing coasts as surface waters are blown off-shore. Therefore the first response to a “quiet” sun would be warmer seas (and El Ninos) and moister, milder air.  And Indeed the El Ninos have been strong and the La Ninos a bit feeble recently, and to this day the planet looks above normal at the equator.

https://www.ospo.noaa.gov/data/sst/anomaly/2020/anomnight.4.20.2020.gif

However such warmth draws upon the bank account of the past, robbing from Peter to pay Paul, and there are indications that, in the Pacific, it is superficial, and is currently being eroded away from below:

Only when the cold water reaches the surface and a La Nina occurs is my bias confirmed.

Second, one would think a “quiet” sun would immediately create more sea-ice in the Arctic Sea, but in terms of an important component it creates less.

The captains of icebreakers in the arctic keep a sharp lookout for “biggy bergs”, which are different from sea-ice of the same size and thickness. When an icebreaker nudges against typical sea-ice seven feet thick the sea-ice is a conglomerate, made of a multitude of thinner slabs, and the bow of the icebreaker finds it easy to break apart the many smaller slabs. However when a seven feet thick section of ice has broken from a glacier, it is rock solid, and the icebreaker gets quite a jar, meeting a “biggie berg”, even if the icebreaker doesn’t sink like the Titanic.

What is interesting about “biggy bergs” is that they are more common when the arctic is warming, and are few and far between when the arctic is cooling. And every Alarmist knows why: Warming causes glaciers to calve more. When times get colder the glaciers stop calving, and extend out to sea more, in some cases becoming shelves of ice.

During the “Modern Maximum” some of the big shelves created by the “Maunder Minimum” broke off, creating handy platforms for the spy-vs-spy bases of Americans (for example “Fletcher’s Ice Island”) and Russians  (for example the basement of their base “NP 22”, which was occupied more than eight years.) However, besides these large “ice islands”, which are few and far between, there are a great many “biggy bergs” deposited into the arctic ocean from glaciers that face north, and whose calving ice is not swept south in Baffin Bay or south along the east coast of Greenland, and instead bobs about in the Arctic Ocean along with more ordinary, conglomerated sea-ice, which is formed yearly by winter cold.

To me it seems “biggy bergs” must have an influence on both “volume” and “extent” of sea-ice, and it seems counter intuitive to me that the colder it gets the less they are seen (because north-facing glaciers cease calving them as it gets colder).

There is a third counter-intuitive thing happening I haven’t yet been able to put my finger on. All I know is that once again my confirmation bias has been sat backwards onto its butt. It has to do with how fast the Polarstern has been progressing across the Pole, and what this means in terms of Svalbard. With so much sea-ice rushing towards Fram Strait, by April 1 sea-ice surrounded Svalbard to levels I’ve never before seen.

https://realclimatescience.com/wp-content/uploads/2020/04/CICE_combine_thick_SM_EN_20200401.png

The build up of sea-ice around Svalbard is a little embarrassing for Alarmists, for a few years ago the situation was reversed, and south winds had pushed the sea-ice north of Svalbard even on its eastern side, which is relatively rare, and which Alarmists took to be a sign of Global Warming (and the doom of cute baby polar bears).  Now the sea-ice has returned with a vengeance, as have the highly adaptable bears (though hopefully the bears feel no vengeance).

Alarmists likely want to look away from Svalbard, but actually should take heart, for the “second lowest sea-ice extent evah”, in 2007, was achieved largely because a great deal of sea-ice was flushed south through Fram Stait. (Sea-ice south of Fram Strait is doomed to melt in southern waters).

(The site “Polar Bear Science” has a good post on the recent high sea-ice Svalbard situation here:)

Highest Svalbard sea ice since 1988 with Bear Island in the south surrounded

The problem with comparing the situation now with 2007 is that…well…it isn’t the same. That is what is troubling me, and I can’t quite put my finger upon.

Some things are similar: For example 2007 was also close to the minimum of a sunspot cycle, however 2007 was coming off a high maximum while we are now coming off one of the lowest maximums in the past 200 years. Also 2007 was at the heart of the “warm” AMO, while there are indicators suggesting we are now at the very end of the “warm” AMO.  Lastly, while Alarmists like to show decreasing sea-ice by starting their charts in the high sea-ice year of 1979, even their charts show things bottomed out around 2006-2007, and there has even been a slight rise, if you begin the “trend line” at that time rather than at 1979. For example, here is graph for extents in the month of March.

March 2020 average graph 1979-2020 NSIDC

You can’t help but notice the extent is now higher than 2006.

However what was most puzzling to me on April 1 was the sea-ice to the west of Svalbard. That should make any sea-ice geek quirk an eyebrow, for that area is nearly always free of sea-ice. That is where the Fram popped out into open water after crossing the Pole, 1893-1896, and that is where Willem Barentsz “discovered” Svalbard (Vikings likely were there earlier) in 1596. The water is usually open there because a northernmost tendril of the Gulf Stream, the West Spitsbergen Current, bounces off the coast of Norway and heads a little west of due north, entering the Arctic Sea on the east side of Fram Strait.  This current usually has a very impressive ability to melt sea-ice.  I have witnessed strong west winds push large masses of sea-ice across Fram Strait, and seen (in satellite photos) the entire mass of ice shrink and vanish in a few days. But this year hasn’t seen that. What the heck?

My guess is that the WSC (that is what we true geeks call the West Spitsbergen Current) has been cooled this year by the powerful storms we (last winter) saw not stall by Iceland (as is more ordinary) but remain huge into Barents Sea and even the Kara Sea. When such “Icelandic Lows” stay by Iceland, surges of mild air are brought north, sometimes all the way from the balmy Azores, on the storm’s east side. But, when the storms are displaced east, as they were this year, the same waters get north winds on the gale’s west side. This year we saw the waters that hold the WSC blasted by north winds gusting to hurricane force, with waves up to forty feet tall. Not only would this churn and chill the WSC, but it would physically transport the water at the very surface of the current in the wrong direction.

This moves us into an interesting topic, if you are a true geek, involving a sort of water budget.  It must be balanced. The water entering the Pole must be balanced by by water leaving the Pole. The WSC entering the Pole is more than matched by, on the far side of Fram Strait, the very cold EGC (East Greenland Current). More water leaves the Pole by sea than enters by sea, for evaporation is low due to sea-ice and cold temperatures, and much extra water enters via some of the world’s biggest rivers, as well as glaciers.

What is most fascinating is the fact various currents often (but not always) keep their identity as they travel around under the sea-ice. Water from the south tends to be saltier, but is made less salty as it melts sea-ice, yet can still be identified as a separate current.  Some currents dive beneath other currents, because the buoyancy of a current is determined by its salinity and its temperature, which are always changing. When waters are quiet, undisturbed by storms under ice, they can stratify into various layers, with each layer part of an identifiable current. Therefore the WSC, after passing through Fram Strait, forks into the Yerkmak and Svalbard branches, which can be traced all the way around the Pole until they exit as the RAC (Return Atlantic Current) which heads south in the middle of Fram Strait between the Colder and less salty  EGC heading south to the west and the milder and saltier WSC heading north to the east.

To make things either more interesting or more annoying, (depending on your temperament), is that, when you return the following year, things may have changed. For example, the WSC may have three other branches (perhaps more) besides the Yermak and Svalbard branches, but they are not seen every year.

In my humble opinion the study of such currents, and the way they change, is very important. Why? Because they set up certain areas of sea-surface-temperatures (such as the “warm blob” in the Pacific) which have been seen to have a major influence on the route taken by atmospheric jet-streams, which can determine things such as which-crops-are-wisest-to-plant-where.

One such change is the shift in the AMO from “warm” to “cold”, which we know little about because the last time it occurred satellites had barely been invented. It involves some major shifts-in-the-drifts which we will in many ways be seeing for the first time (by satellite, at least). The scant records we have from the past indicate the changes are major. For example, the prime fishing grounds for herring can shift hundreds of miles.

The above newspaper article from 1922 describes how swift and dramatic the change from a “cold” to “warm” AMO was around Svalbard, however it took more than a decade for the warming to start reaching the Russian coast and making the Northeast Passage more passable. (It was fortunate the sea-ice was still low when Hilter invaded Russia, for the British learned it was suicide to attempt to send Russia supplies via the arctic routes during the broad daylight of summer, and despite Stalin’s objections the British only dared do it in the darkness of arctic winter. Had sea-ice been more formidable then supplying Russia might have failed and Hitler might have succeeded.) But, to return to my point,  I assume the change back from “warm” to “cold” might also be swift and dramatic, and might also be first seen around Svalbard.

One major element of the shift-in-the-drift involves a simple fact: Cold water sinks. When the EGC brings cold water south along the east coast of Greenland it stays at the surface because the shallow continental shelf keeps it from sinking, and also to some degree by the fact less saline water is more bouyant than more-saline water, even if it is colder. However down around the latitude of Iceland the bottom falls, and so does much of the EGC.  In a manner that makes niagra falls look like a trickle, humongous amounts of cold water plunge to the ocean’s abyss, and seemingly such cold loses all ability to influence the surface.  But does it?

Allow me to subject you to a simple thought-experiment. Imagine a large box of water is plunged downwards. What will this do to waters at the surface, and what will this do to the waters beneath?

At the surface it is obvious that waters must rush in to replace the water that sinks. But what determines whether it will be warm water rushing up from the south, or cold water rushing down from the north?  History hints both have happened, and that what determines the flows of waters is as varied as what determines the flows of air on a surface weather map. But, on occasions when the flow of waters is increased from the north, the EGC transports south cold water that refuses to sink, called sea-ice. This sea-ice at the surface can change the temperature of sea-surface water hundreds of miles further to the south, changing air temperatures and the weather of lands downwind, and also causing more waters to chill and sink.

Beneath the sinking cold waters is the abyss, which we know little about. However we do know water can’t compress, and when water presses down from above the water beneath must move to make room. Some of this movement is explained by deep sea currents. However such currents are very slow, nor do they vary much. When a charge of bitter cold arctic air causes much more cold water to sink, the deep sea currents don’t speed up, (as far as I know, at this time.)  Therefore things are not adding up. When water presses down from above room must be made for it, but where is the room made?

Two ideas have occurred to me. One idea is that room is made by bulging the thermocline upwards, but this bulge would become a sort of wave moving away through the thermocline like the ripple from a splash, an undersea phenomenon which as far as I know is undocumented, but which, if it did exist, would have some effect when the wave hit a distant coast. A second idea is that, just as when you push a brake pedal an immediate effect is seen in rear brakes far from the actual pedal, when cold waters sink south of Fram Strait, an immediate up-welling effect might be seen in some place far away, because water can’t be compressed. I am well aware this second idea is outlandish, but is it as outlandish as this: (?)

Patient, hard-working scientists have mapped the slow currents of the abyss, and to some degree have mapped the undersea rivers which connect where waters sink and where up-welling brings deep waters back up. Yet none of these rivers ends at the biggest up-welling, off the coast of Peru, which is part and parcel of the switch from El Nino to La Nina.

Thermohaline circulation - Energy Education

Only recently have maps started to include a branch of the thermohaline circulation past the coast of Peru, but this shows a warm surface current and not the cold up-welling so vital to the creation of La Nina’s (and to the fisheries of Peru.)

https://i0.wp.com/blogs.evergreen.edu/seachange/files/2013/05/AlyssaConveyor2.jpg


The generally accepted idea is that the up-welling off the coast of Peru is caused by strong offshore Trade Winds blowing from South America westward into the Pacific. These winds blow the warm surface water towards Australia, which causes cold, nutrient-filled waters to be drawn up from the depths to replace the displaced surface water.  The problem with the idea is that the up-welling has a degree of independence from the wind. At times the up-welling can even occur before the increase in the Trade Winds, in which case the colder water appears to be causing the increase as much as the increase causing the colder waters. This has two effects. First, it makes El Ninos and La Ninas notoriously hard to forecast, and second, it allows madmen like myself to suggest that pushing water down in Fram Strait can cause water to up-well off the coast of Peru.

In any case the shift-in-the-drift off the coast of Peru has major repercussions, in terms of the world’s weather, just as the shift-in-the-drift in the North Atlantic associated with the switch of the AMO from “warm” to “cold” has major repercussions, in terms of the world’s weather. Such major repercussions are interconnected in ways we do not yet understand. Inquiring minds want to know. Scientists state “further study is needed”, holding out a cupped palm for money.

In my opinion the late Bill Gray’s desire for funding to better understand thermohaline circulation was intuitive genius, while Al Gore’s petty prevention of such funding was the initial travesty which has seen Global Warming politics befoul science. Money which could have been wisely used to further our understanding has been redirected to political hacks. Things important to study have been neglected to study the incidental. Not that I have anything against the study of polar bears, but bears can’t determine which crops to plant in Kansas, while the shift-in-the-drift can.

In order to redirect funding in unproductive ways, politicians always seem to need to invent a crisis, whether it be acid rain, or ozone holes, or global warming, or a corona virus pandemic. The problem is that when you are too unproductive you wind up broke.

End Rant.

In any case it will be interesting to watch the sea-ice in the North Atlantic as the winter gales die down and the quieter summer weather arrives. For five years now the two long-term measuring points of the Norwegan Current, which feeds into Barents Sea, have been noting a decline in water temperatures:

Sea-ice extent is within two standard deviations from normal, and high for recent years, though still low.

DMI 200424 osisaf_nh_iceextent_daily_5years_en

Both the Kara and Laptev Seas have seen a lot of sea-ice exported north into the Central Arctic this winter, and thin baby-ice now skims them, so I expect a fair amount of Alarmist hoop-la to occur when they become ice-free this summer. This may be reflected in a plunge in the extent graph, as they melt. However the hoopla may then die down as the extent graph flattens, as other parts of the Arctic Ocean see sea-ice more stubborn. If the PDO remains in its “cold” phase it will be especially interesting to see if sea-ice remains stubborn north of Bering Strait.

The “volume” graph is currently very low for this time of year, likely due to the thin ice in the Laptev and Kara Seas, and also due to an incapacity inherent in measuring the volume of pressure ridges, which are numerous in the Central Arctic due to all the sea-ice transported north from the Kara and Laptev Seas. I expect the “volume” graphs to become more normal later in the summer, when pressure ridges tend to crumble and spread out, and be included more easily in the totals.

The MOSAiC expedition is now experiencing 24 hour daylight, and I am enjoying the pictures I crave, which have been sorely missed since the camera-buoys stopped being funded. The scientists are enjoying the one part of the world without corona virus, and witnessing first hand how very dynamic the sea-ice is. A large lead snapped the cables powering one of their remote station, forcing them to operate at a reduced capacity with generators for around three weeks until they were able to lay a new cable.

MOSAiC lead Screenshot_2020-04-23 MOSAiC(1)

Other leads have opened and crushed shut again, forming pressure ridges.

MOSAiC Pressure ridge 4-20 Screenshot_2020-04-23 MOSAiC(2)

MOSAiC Pressure Ridge 4-16 Screenshot_2020-04-23 MOSAiC

Some of the things they are studying are fascinating, such as the biology under the ice. Other studies seem based on the Global Warming narrative, and make me want to roll my eyes. (I will bite my tongue, regarding measuring the nearly non-existant amounts of nitrous oxide exuded by the Arctic Ocean.) (Of course, data is data, and when I was young I would have counted the number of leaves on a tree, if it let me avoid getting a Real Job.)

What really interests me is the shift-in-the-drift, but things do get more tranquil in the summer, and the currents slow down. (The WSC north through Fram Strait nearly halts at times.) While the Polarstern had been making steady progress towards Fram Strait, it recently experienced a bit of “wrong way” drift.

MOSAIC wrong way Screenshot_2020-04-23 MOSAiC(3)


This expedition is experiencing some interesting resupply problems they are not talking about, due to the rest of the world going crazy due to the Corona Virus. If they dawdle too much, getting down to Fram Strait, their story could get interesting.

Stay tuned.

ARCTIC SEA ICE —Awaiting La Nina Del Norte—

There is always a lag between the time an event occurs in the tropics and the time the effects of that event reach the Pole. But there is no lag, when it comes to the effect of the sunshine actually striking the Pole. Therefore the effects of the “Quiet Sun” at the Pole are immediate, in terms of sunshine, but lagged, in terms of the complex manner the Quiet Sun effects the temperature of the oceans at the equator.

I think we have seen this in the temperatures at the Pole. From the moment the sun started to get high and bright in arctic skies in May, the temperatures were below normal. Then, from the moment winter darkness begins to spread south from the Pole in September (and the sun can have very little effect at the Pole because it doesn’t shine) temperatures have been above normal.

DMI5 1004 meanT_2017

It is common sense that the sun only effects the Pole directly when it is shining, (though certain people will make it more complex than it needs to be.) It is also common sense that as soon as the sun sets at the Pole something besides the sun must be involved, when it comes to transporting heat to the Pole.

The transport occurs via air masses.  The planet is constantly attempting to achieve a balance, though arriving at a point where the entire planet is the same temperature is impossible. Just as we will always have our poor, we will always have our Poles. As the planet attempts to move all the equator’s heat to the Pole, it is attempting the impossible, and is in some ways like a socialist attempting to move the wealth of the rich to the poor. It even gets nasty, with hurricanes and gales, like socialists do with taxes. Unlike socialists, the result is a beautiful planet.

(In case you are wondering, I’m currently doing my taxes.)

The transport also occurs via ocean currents, but much more slowly. The heat we currently notice at the Pole largely comes from a meridional flow, where the jet stream develops loops that hurry the mixing of arctic air with tropical air. When the difference between the Pole and the Tropics is less pronounced there seems to be less need of mixing, and the jet stream gets less loopy, and that flow is called “zonal.”

I have been working on the idea, the past year, that there is a third flow, that creates an area of low pressure at the Pole which, for my amusement, I have dubbed “Ralph.” I suppose this third flow is actually an “extremely meridional” flow, but I’ve decided to call it a “Ralphal” flow, because I’ve always wanted to contribute something to science, and coining words is fun.

My assumption was that the Ralphal flow was prompted by a larger-than-nornal difference between the tropics and Pole, brought about by the very big El Nino in 2015. I further assumed that the sway in the direction of El Nino conditions would be followed by an equal-and-opposite sway in the direction of a La Nina, as that usually happens. But it didn’t. We had a feeble La Nina, not equal-and-opposite at all, and then the Pacific looked like it was heading right back to El Nino conditions.  So all forecasts could get thrown right into the dumpster.

But then, even as I busily wiped the egg off my face and adjusted all my forecasts to expectations of an El Nino, that fickle Pacific flipped right back towards La Nina conditions. This is why so many quit attempting to forecast the weather. They don’t like having their sanity messed with. (Fortunately sanity is never anything I’ve had to worry about losing, being blessed with madness to begin with).

Nino 20171003 nino34Sea(58)

The long term effect of this La Nina will likely be to generate cooler air masses, which in a lagged way will make their way up to the Pole, but likely this change will take its sweet time to manifest. When we check to see if sea temperatures are below normal, we notice the southern hemisphere may be surprisingly cool but the northern hemisphere remains surprisingly warm.

SST anomaly 20171002 anomnight.10.2.2017

With all that extra heat to the north, the planet had the urge to lose, and that tends to encourage the development of hurricanes  and typhoons. The set up was one which made the Atlantic the place for them to develop this year, and the above map actually shows their effect on the Atlantic’s waters. The heat was sucked out of the water off the east coast of the USA. (To the north the water is warmer because the hurricanes prevented the up-welling of cold water south of Labrador and Nova Scotia.)

On a whole all the heat coming from the northern ocean made the planet milder, but that mildness was hurried to the Pole, to be lost to the growing dark of winter night. The favorite route was up through the North Atlantic past Norway, over Svalbard, which was well above normal in September, as Roy Spencer’s September air temperature map demonstrates.

Temperatures september_2017_map (1)

The above map averages out some of the loopy shifting of the jet. For example, at the start of September it was very cold in the east of the USA, with unusually early snows on peaks not far north of where I live, and even a few spots of late August frost, but by the end of September we were midst a heat wave, and the unusually early snows had shifted to the west of the USA. Result? The map averages the extremes out, and most of the USA looks “normal”.

However Svalbard, at the top of the map, was the most “above-average” place on earth. (Not that anyone went swimming in the icewater.) This is a definate sign of a Ralphal flow, and we did see Ralph incarnating up over the Pole, even as a decent gale for a time. (September 21 map below)

DMI4 0921B mslp_latest.big

This flow continues to fascinate me, but I continue to think it must be at its end. Eventually the effects of the new La Nina will work north, and we’ll see what I imagine will be an abrupt shift to a more zonal flow. When?  (Wait while I flip a coin.) My guess is February 13 at 6:00 PM, EST.

I’ve been saving maps since late August, and hope to go through what we’ve been seeing the past month in more detail. But first I have to face my blasted taxes. (I got an “extension” back when they were due on April 15, but it runs out on October 15. Even a great procrastinator like myself must someday face the music.)

For people interested in the sea-ice itself, it is growing back swiftly now.

DMI5 1003 osisaf_nh_iceextent_daily_5years_en

As an interesting side-note, the mild air pushing north past Svalbard has pushed the ice away from its north coast, but this may actually be also preventing ice from being flushed south through Fram Strait and the east coast of Greenland. Though this reduces the sea-ice in the short term, in the long-term it keeps the ice up in the Arctic Sea, and increases “volume” if not “area” and “extent”.

Svalbard FullSizeRender

Here’s a comparison with last year. (2016 to left; 2017 to right.)

One topic I hope to talk about in the future is the interesting way the sea-ice was jammed south last summer into the channels in the Canadian Archipelago. Some thick, multi-year ice flowed south to the east of Melville Island and across Parry Channel. This may enter the calculations of people attempting the Northwest Passage  next summer. We can only cross our fingers and hope our poor, odd, battered O-buoy 14 camera survives another winter, in that area. Obuoy 14 1003 webcam

Stay tuned.

ARCTIC SEA ICE –In The Ink–with Freak storm update (Dec 12-31, 2015)

The days are not just short at the Pole; they don’t exist. The entire area north of the arctic circle is now sunless, 24 hours a day, and in terms of the planet’s heat budget the area is spending like a drunken sailor. Colossal amounts of heat is being exported upwards to Alpha Centuri, where they don’t need it.

What our president should do (as he is a madman who thinks he can control the weather) is to make it illegal for any warmth to go north. It is a complete waste to send warmth north this time of year. Keep the warmth down south where the people are. Let the north get so cold that it freezes the arctic sea-ice thick, and has no further warmth to squander, even from the Arctic Ocean. In terms of the planet’s energy budget, it can be fifty below up at the Pole, and all it means is we are not wasting our warmth. Unfortunately our poor president doesn’t have a clue, when it comes to budgets.

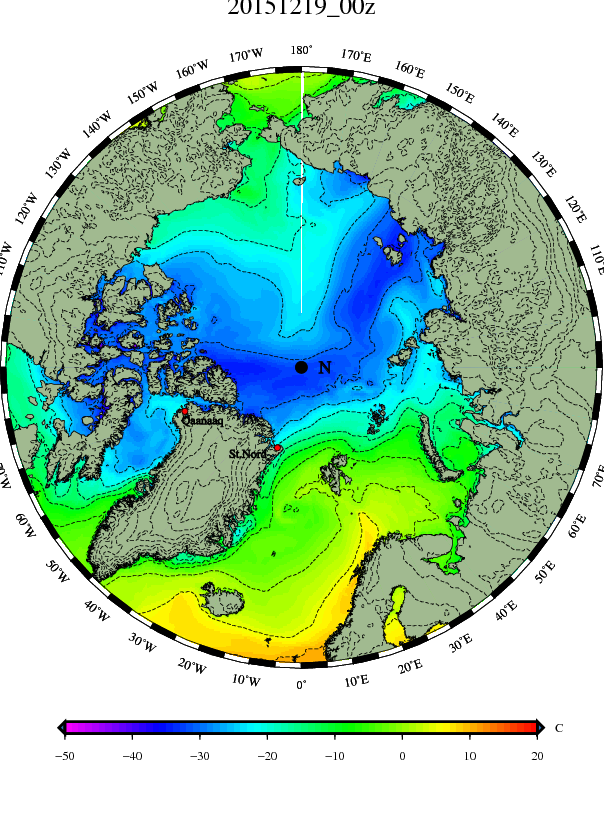
In actual fact whomever of the Creator’s angels is in charge of the weather has kept a lot of the cold up there recently. The O-buoys 8b, 13, 14, and 15 (with blinded cameras) have been reporting temperatures down near -40° C.  This has occurred because, on the Asian side of the Pole, we have seen something close to a “zonal flow”, where winds describe a nice, neat circle around the Pole, and the jet stream doesn’t form the grandiose loops south and north that can bring snows to Florida even as cherries bloom in Scotland.

On the North American side the jet stream did loop south, bringing record snows to places like Denver, but from the Atlantic to the Pacific over Eurasia the flow was fairly flat. Great surges of relatively mild Atlantic air surged west to east. I called one a “javelin” in another post, but they were more like snowplows, pushing the Siberian air left, right and forwards. The supercold air that went right became involved in a counter-current, east-to-west, and also involved more moisture than cold deserts usually see, so there were record snows from northern China and the Gobi Desert in Mongolia back to Turkey. There was even winter in Uttar Pradesh in northern India.

http://iceagenow.info/heavy-snowfall-in-india/#more-17480

This demonstrates that it is not just the Pole that is squandering heat. Areas south of the Arctic circle may see some sunshine, but a four hour day cannot make up for a 20 hour night, especially over Siberia when the snow-pack is deep. All that nice Atlantic air heading west-to-east gets colder and colder as it moves into and across Russia. All the Atlantic air  does is supply unusual moisture and make the snow-pack deeper. However the thrust of Atlantic air does shove a lot of cold air to the left, north towards the Pole, and -15°C is better than -60°C, if you happen to live in Siberia. I’m sure they appreciate lower heating bills, the same way everyone else does, and with so much cold trapped up at the Pole, it has been a Christmas Miracle to the poor in the eastern USA and much of Europe to pay so little staying warm.

In order for a zonal flow to persist it has to be even all the way around the Globe. Otherwise some of the very cold arctic air moves south and comes in contact with nice, juicy air over the Atlantic or Pacific, and “bombo-genesis” occurs, and you abruptly see an enormous gale on the map. The gale is so huge it tends to bend the jet stream north and south, and before you know it your nice, neat zonal pattern has been utterly messed up, and becomes a meridenal pattern.

This seems to be what has happened recently. A huge gale blew up in the Aleutian Sea, followed by a teleconnected gale in Fram Strait. I hope to find time to post all the maps tomorrow, but for now will merely mention that Faboo (the North Pole Camera) has experienced winds over fifty mph, has made it south of 77.5° latitude, and (somewhat amazingly) the cameras are still functioning and producing regular photographs of ink.

INK AVALANCHE IN SVALBARD

A tip of the hat to the bloggers Craigm350 and lectricdog, who sent us these links.

http://www.bbc.co.uk/news/world-europe-35144236

Apocalyptical snow storm and avalanche engulf Longyearbyen, Svalbard at the end of the world

The gale, with hurricane force gusts, is described as the worst to hit Longyearbyen in 30 years.

Svalbard snow storm and avalanche, svalbard apocalyptica l snow storm, snow storm svalbard norway, weather apocalypse svalbard norway, snow storm and avalanche svalbard december 2015, hurricane svalbard 2015, strongest storm in 30 years svalbard december 2015

A WEEK’S WORTH OF DMI MAPS

Before I even start these maps I should show what the super-gale winding down, south of Bering Strait, off the first map.Aleutian Storm gfs_mslp_uv10m_npac_1I likely missed the lowest pressure this storm achieved; the lowest I noted was 943 mb. Computer models were suggesting it could get down to 930 mb briefly, so of course some Alarmists pounced on it as evidence Global Warming was producing “unprecedented” weather. (Actually other storms have likely maxed-out at the same levels up there, out to sea where nobody can measure them.  It is unlikely for such storms to peak as they come ashore, as the land destabilized the perfected requirements. Even as they peak they use up their energy swiftly, and while still remaining monster storms, see their pressures rise.)

I bring up this particular storm to illustrate the massive amounts of mildness and moisture brought north,  to be squandered in the ink. In the following DMI maps you can see the milder air push north into the Pacific side of the Pole, even as very cold East Siberian air oozes north and across the Pole to Canada, and then the Svalbard Bomber blowing up in the Northernmost Atlantic.

DMI3 1212B mslp_latest.bigDMI3 1212B temp_latest.bigDMI3 1214B mslp_latest.big DMI3 1214B temp_latest.bigDMI3 1215 mslp_latest.big DMI3 1215temp_latest.bigDMI3 1216 mslp_latest.big DMI3 1216 temp_latest.bigDMI3 1216B mslp_latest.big DMI3 1216B temp_latest.bigDMI3 1217 mslp_latest.big DMI3 1217 temp_latest.bigDMI3 1218B mslp_latest.big DMI3 1218B temp_latest.bigDMI3 1219 mslp_latest.bigDMI3 1219 temp_latest.bigDMI3 1219B mslp_latest.bigDMI3 1219B temp_latest.bigDMI3 1220B mslp_latest.bigDMI3 1220B temp_latest.bigDMI3 1221 mslp_latest.bigDMI3 1221 temp_latest.big

For the moment the upper air map shows a nice, neat quasi-zonal pattern, with lows rotating a high parked at the Pole, but the pattern is in self-destruct mode, and will look very different in a matter of days500 mb Polar 21051221 gfs_z500_sig_arctic_1

A lot of the arctic cold, when it hasn’t remained trapped over the Pole, has poured over the Pacific east of Russia and then made its way south to the Western USA. More has flooded south down either side of Greenland, occasionally crossing the Atlantic to chill northern Scandinavia, however mostly it has been ocean waters that have borne the brunt of winter rather than people.  This looks like it will change. Though there is no snow in the eastern USA the snowpack has built in Ontario south of Hudson Bay, and the snowline looks likely to leap southward at the start of the New Year. Europe may dodge the bullet a bit longer.

UPDATE ON ICE EXTENTS

The weakest ice around the Pole is the newest baby-ice, perhaps only three inches thick, extending outwards at the edges, and the one thing that can discourage the growth of such ice is a roaring gale. We have seen two, if you generalize. If you want to count the gale’s secondary gales the number is higher. Such roaring winds can take a square mile of sea-ice three inches thick and crunch it like an accordion to a far smaller area of jumbled slabs.

It is strangely similar to what happens to a flat summer beach, long merely lapped by gentle ripples, when it is hit by several autumnal gales and hurricanes. It is flat no longer. A big dune rises just inland, and a big off-shore sandbar rises just out to sea.

In fact, if you look at the very edge of the sea-ice when the sun first returns to the north it is uncanny how smooth the edge looks, as opposed the more usual blocky look of broken-up sea-ice. It has all the curls and capes and inlets of a sandy shoreline, and hints at how pulverized and fluid the ice became during storms in the ink of winter dark and winter gales. During calms it expanded out as thin baby ice, but during storms it was reduced to many small chunks, basically a soup of slush.

If you pay attention strictly to “sea-ice extent” without paying attention to what the sea-ice is undergoing, you will be puzzled by times the extent shrinks even when temperatures are below, and sometimes far below,  the melting point of salt water. Once you pay more attention you expect the charts to dip, or at least flatten when the ice is subjected to super-gales. And indeed we have seen the extent flatten, both in the DMI 15% extent graph and in the DMI 30% extent graph.

DMI3 1222B icecover_current_newDMI3 1222B icecover_current

I try to keep two things in mind, during such occurrences. First, there may be just as much ice, but it is heaped up into a smaller area, like an oceanic sand dune, or like all the snow on your driveway being shoveled to the edges. Second, the creation of more open water cannot result in any warming of the water when the sun doesn’t even shine. In fact the water is often churned and chilled to a considerable depth by the howling gales, and this process will continue until either the water is sheltered by a roof of ice, or the sun starts beaming over the horizon and rises high enough to penetrate the surface.

In any case, calculating the energy budget of arctic waters is no easy thing, and one should avoid the knee-jerk reaction of certain simpletons, who see a dip in sea-ice extent as a sure sign of warming.

FABOO’S REPORTS, AND SURPRISING SURVIVAL

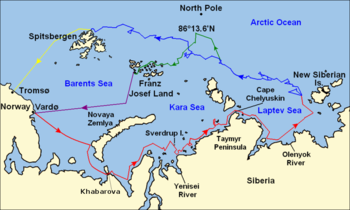
Faboo (my name for the North Pole Camera) may only represent a small chunk of a vast Arctic Sea of bergs, however I feel that the study of Faboo’s antics at least gives us an iota of an idea of what is going on, where we otherwise might see only ink.

On our last post on December 12 Faboo had slowed down a lot, and drifted another 5.81 miles SSW to 78.494°N, 8.274°W. Temperatures had dropped to -28.5°C, and the hoarfrost had grown so thick that apparently both the wind-vane and anemometer were immobile. The cameras likely had encrusted lenses, and produced nothing but pictures of ink.

On December 13 the buoy sped up, moving 12.21 miles nearly due south (but slightly west) to 78.317°N, 8.292°W, as temperatures nudged up to a high of  -21.5°C at 1500Z.

On December 14 Faboo crossed 15.31 miles a little west of due south, reaching 78.098°N, 8.471°W. We can assume the winds were picking up. Temperatures were basically flat, with a low of -22.5°C at midnight rising to a high of -20.1°C at 0900Z before creeping back down again.

On December 15 we veered a bit to the SSW, covering 11.34 miles and arriving at 77.935°N, 8.602°W. Temperatures crept down to a low of -24.5°C at 1800Z.

On December 16 we experienced a bit of a lull, moving only 8.24 miles to 77.953°N, 8.588°W. However in Fram strait such lulls, combined with the fact temperatures steadily rose to -18.8°C, make me suspicious warm air is surging north and a storm is brewing.

On December 17 the Svalbard Bomber began to blow up. Faboo picked up speed and veered SW, moving 14.1 miles to 77.740°N, 9.713°W, as temperatures, -18.3°C  at midnight, rose to -12.0°C  at noon and then -3.4°C at the end of the period. (2100Z) However the real hint was that the winds grew so strong the anemometer blasted free of the hoarfrost, reporting steady winds of 42 mph at the end of the period. (Please note that, although so far the ice Faboo is on has traveled more than 60 miles south in this report, towards eventual melting, it has had little to do with warming, and has in fact involved temperatures so cold you might think (as I once thought) that the sea-ice would be locked rigidly in one place.)

On December 18 the Svalbard Bomber had steady winds of over 40 mph for most of the day, peaking with a steady gale of  51 mph at 0300Z. There was an interesting lull at 1500Z, when winds dropped to 13 mph. Temperatures at that point had fallen steadily to -9.2°C, but at the 1800Z report they’d sprung up to a high of -1.5°C, and winds were back up to 40 mph, and ended the period at 45 mph.  We moved an impressive 27.93 miles SSW to 77.429°N, 10.921°W.

On December 19 the gales blew all day, only slacking to 38 mph at the end, as temperatures steadily fell from -3.0°C to -13.3°C . Faboo charged another 31.71 miles SSW to 77.004°N, 11.716°W.

On December 20 the Svalbard Bomber faded east, and winds slowly decreased from gales to a strong breeze of 20 mph at the end, as temperatures remained fairly flat, with a low of -13.7°C  at noon and a high of -12.6°C at 1800Z. Faboo moved 21.1 miles further south, arriving at 76.710°N, 12.090°W .

On December 21 winds faded further, down to around 11 mph, and the flat temperatures took a plunge to -21.5°C at the end. The ice began to rebound to the east, after being crunched up against the coast of Greenland, which makes me nervous, because it was during such a period of rebound, after a gale, that we lost O-buoy 9. I imagine leads open up. Despite the slackening winds Faboo moved another 11.4 miles south to 76.547°N, 11.970°W.

What amazes me is that the cameras are still reporting. They may be face downwards, but they send their pictures, four times a day. I even think I can detect a slightly less inky ink at noon. (Though the sun doesn’t rise down towards the arctic circle, the twilight gets brighter at noon.)

If I could have a Christmas wish, it would be that at least one of the cameras survives long enough to have its lens thaw, and that it then sends a few pictures of the mess we can’t currently see. You can bet the ice isn’t as flat as it was up at the Pole last April, when we got our first pictures. However that ice must be surprisingly stable and strong, for the cameras to have survived such gales. (The instrument that measures how thick the ice is quit working back at the end of November.)  (The ice was roughly a meter thick at that time.)

POST-CHRISTMAS UPDATE

The gales up in the arctic have done a good job of compressing and chewing away at the outer edge of the sea ice both on the Atlantic and Pacific side. Despite the cold winds blasting off east Siberia and down either coast of Greenland, there has been little chance to grow the fragile ice at the edges, and graphs focused on the extent (or area) of the ice show a slump or leveling-off, both on the DMI 15% and 30% graphs.icecover_current_newicecover_current

Besides the compression of sea ice, there has also been warmth that has been a blessing to those who pay heating bills, eroding the snow-cover in the east if the USA right up across the border into southern Ontario and Quebec, and across Europe right into Russia.Snowcover 20151224 snowNESDISnh(11)

Of course such mildness holds moisture, and once such mild surges move a certain distance across northern landscapes temperatures can be above normal but chill to a degree where they still build the snow-pack, which has happened in the rest of Russia, and also in northern Ontario and Quebec and even Northern Maine.  Also such surges, in Eurasia, have led to an interesting backwash the other direction, a sort of counter-current bringing snows to India, Pakistan, Iran and Turkey, and even Romania and the Italian Alps.

That snow-pack is a winter-breeder, as it reflects the wan winter sunlight during the short winter days, and during the long nights radiational cooling is at its yearly high. Deep snow to your north is not a friend, if you yearn for a mild winter.

In like manner, frozen over lakes and bays are not a friend, as open water is an amazing buffer against a cold wave. This year the Great Lakes have not chilled as swiftly as last year, and on his excellent blog at the Weatherbell site Joseph D’Aleo posted a Dr. Ryan Maue map which does an amazing job of showing how arctic winds passing over the Great Lakes are significantly warmed, to the benefit of areas downwind of the lakes. (In this case the frigid winds are west-to-east, and it is areas to the east that benefit.) Great Lakes downwind cmc_t2m_east_33

At the very top of the above map is southernmost Hudson Bay, which is only slightly warming the air, for the big bay is about frozen over. Even the Canadian Ice Service map, (which seems to be the last to show ice freeze in the fall and the last to see it melt in the spring, perhaps because they have a finer grid), shows the bay nearly completely frozen over. Hudson Bay 20151226 CMMBCTCA

Besides Hudson Bay, Canada has its “other” Great Lakes, plus a vast number of smaller lakes and ponds, which show up as yellow specks (indicating they are frozen over) in this map.

Snowcover 20151226 ims2015359_alaska

In conclusion, all those nice buffers, waters holding summer’s heat and steaming in the first cold of fall, have lost their ability to be the protectors of southern lands. Rather they help worsen the radiational cooling during the long winter nights, and have switched sides, turning from a foe of cold to a friend.

It is for this reason that temperatures show no sign of uplift, as the shortest day passes and days start getting longer. Until those ponds, lakes, bays and seas start to melt a slight increase of sunlight not only has no effect, but the cold gets worse.

Which led to the wisdom of a bit of old, Yankee doggerel:

When the days begin to lengthen
Then the cold begins to strengthen.

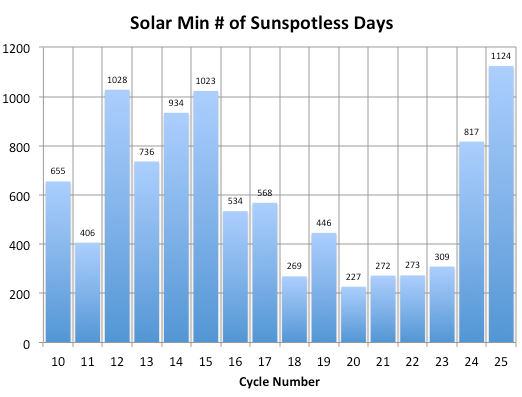
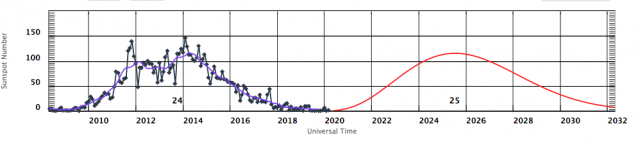
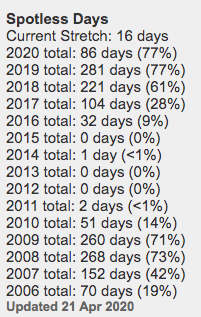
Which means we will see sea-ice continue to grow past current levels:Consentration 20151226 arcticicennowcast

FABOO SURVIVES GALES; CONTINUES GRINDING SOUTH

On December 22 Faboo continued another 8.53 miles a little east of due south, finishing at 76.425°N, 11.881°W.  This is pretty good progress, considering the winds died down from a breeze of 11 mph to slight draft of 5 mph. We never saw Faboo move so far when winds were so light in the summer, however at this point we are seeing a sort of accumulated momentum; the ice and sea-water remembers the gales of the past week, and now forms a current down the east coast of Greenland. It is sort of like when you stop stirring a cup of tea, but the tea keeps moving.  The sea-ice is not frozen to a halt by sub-freezing temperatures, for Faboo saw a high of -21.5°C at the start of the period and a low of -25.3°C, and those extremely cold temperatures didn’t seem to slow Faboo a bit.

On December 23 the winds started to pick up a bit, from 6 mph at the start to 20 mph at the end, and temperatures reached a low of -24.0°C at 0300Z and crept back up to -21.8°C at the end of the period (2100Z). We were shifted primarily south, with our eastward drift ceasing on  11.684°W at 1800Z and then starting westward again, as we wound up at  76.207°N, 11.702°W, which is another 15.31 miles further along.

On December 24 strong breezes and cold temperatures lasted all day, with the breeze between 18 and 25 mph and the temperature between -21.4°C and -24.1°C. The buoy traveled another 22.19 miles, finishing at 75.890°N, 11.934°W.

On Christmas the strong winds began to slack off in the late morning, gradually ebbing from 22 mph to 11 mph. Temperatures remained cold, sinking from -21.1°C at 0600Z to -24.1°C at the end of the period. Our westward progress halted on 12.100°W and we began to be nudged east again, as our general motion continued to be for the most part due south, finishing at 75.592°N, 11.978°W, which is another 20.56 miles on our way.

On the past six days we have moved a hundred miles south from where this map shows Faboo located, back on December 20.2015D_track 20161220 (1)

We are actually getting down to that next circle of latitude on the above map, which represents 75° north Latitude. We sure have been zooming, especially when you consider how long it took us to get across 85° north, and how there was even some doubt we would get into Fram Strait, or whether we’d get sucked west into the Beaufort Gyre.

Well, all doubt has been removed, for now we are officially through Fram Strait, and farther south than the most southern point of Svalbard. In which case, you may ask, why follow Faboo any longer? There can be no doubt the buoy is on its way to to melting in the Atlantic south of Denmark Strait.

Well, one reason to follow Faboo is that there seems to be a misconception about ice moving down the east coast of Greenland, especially because, in terms of “extent”, the ice forms a narrower and narrower band along the Greenland Coast. The misconception is that it is becoming a narrower band because it is melting away.Fram Ice 1226 general_20151223

If you open the above map to a new tab and then click it again you can get a very enlarged version. The orange lines are isotherms indicating the temperature of the sea-water, and show a lot of that sea-water is below the freezing point of fresh water. This includes the northern Barents Sea, the area of open water northwest of Svalbard, and the water moving down the east coast of Greenland. In fact the current moving south along the Greenland coast is one of the coldest in the world, as water that cold usually takes a dive, as it is so much denser than the warmer waters it moves into.

The question should then be, why doesn’t this Greenland current take a dive?  Well, it actually does, further south, but at this point (where Faboo reports from) it doesn’t dive because it is fresher water, and also is not moving into warmer water yet. It is extremely cold salt water that could literally freeze your blood solid, and when it is blasted by steady winds of -20° to -25° there is no way any melting is going on. In fact every bit of ice in that water is like a candle’s wick being dipped in wax as it is made; it is growing, not shrinking. It is also (this year especially) piled up against the coast rather than spread out over the sea, which creates a jumble of thicker pressure ridges. In fact, compare the thickness of the ice along the east coast of Greenland last October 28th (top map) with today’s(bottom map).

Thickness 20141028 arcticictnowcastThickness 20141227 arcticictnowcast

You may want to open these maps to new tabs and then click back and forth to compare them. What is clear is that a lot of the ice on October 28 is a lilac hue, indicating it is thin, only around a foot thick. Now it is a sky blue, indicating it is 5-6 feet thick, and even red right along the coast, indicating it is 12 feet thick. In conclusion, the ice moving down the coast of Greenland is not melting, though it is compressed to a narrower and narrow band along the coast, much of the time.

This ice, as well as the ice moving down the east side of Baffin Bay and then along the coast of Labrador, has a power the water lacks. The cold water takes a dive, under milder waters, but this ice floats right over milder waters, which swiftly become colder, as does the air. (Mixed in with this sea-ice are calved-off chunks of Greenland glaciers, which make them especially dangerous to ships like the Titanic). Such ice-water currents also can mess up carefully prepared models of how colder and milder currents should behave, for they are in effect a cold current that refuses to take a dive.  If a sizable raft of such bergs heads south they can create pockets of very cold water where, in theory, only milder water ought be, and if that water takes a dive much further south than models expect, you can imagine the frightful mess is makes of all the neatly drawn currents.

(My youngest son told me that when they were first engineering metal ships they did not calculate correctly for how much metal would shrink in such cold waters, and how brittle rivets would become, which was one reason the Titanic sunk so quickly, and was a reason early battleships developed unexpected major leaks. Live and learn…if you are an engineer…but if you are like some climate scientists, you live and never learn.)

The amazing thing is that Faboo is still somehow surviving to a degree where it still transmits pictures, though they still only show ink….though… perhaps… the late afternoon picture is a little less inky than the noontime shot? Arctic twilight peeking under clouds?NP3 1 1226A 2015cam1_2NP3 1 1226B 2015cam1_1

HEAT-SUCKER WHIRLPOOL GROWS AT POLE (DMI MAPS)

Below you will see why true meteorologists have been known to sneak off during all sorts of important events to glance at maps, for I missed a few due to Christmas and an investigation of Obamacare, and I can see I missed a crucial switch from the cold air being penned up at the Pole to the Pole becoming a whirlpool sucking up our planet’s warmth.

—–Missing Christmas Map—–

—–Two Missing Maps—

This is likely not the end of the whirlpool, for the GFS model shows a second influx of Atlantic air surging up to the ink of the Pole, where it vanishes into outer space. (These superb maps are produced by Dr. Ryan Maue from GFS data, and are available at the Weatherbell site.)

Initial (1800Z December 29) Whirl 1 gfs_t2m_arctic_118 Hour forecast (December 30 1200Z)Whirl 2 gfs_t2m_arctic_436 Hour forecast  (December 31 0600Z)Whirl 3 gfs_t2m_arctic_754 hour forecast (Happy New Year!!!)Whirl 4 gfs_t2m_arctic_10

In the final map a new, smaller swirl is forming north of Greenland, as the major swirl collapses and fills in. What is most impressive is the huge amount of air chilled. Don’t forget it begins above freezing, so you need to add in all the latent energy released, first as the water vapor becomes liquid, and then as it freezes. Also a lot of uplift is occurring, so the heat is raised up to the tropopause, which is lower at the Pole.

Perhaps the situation is analogous to a big, fat guy running to a swimming pool and doing a cannon ball at the center, and the splash being so big the pool winds up empty. Or maybe not. (I just like that image.) In any case what goes up must come down, and with all the air rising and cooling at the Pole air has got to be sinking around the edges. The situation aloft is very different from when we started this post. The “Polar Cell”, (if it exists at all and has not been replaced by a displaced “Ferrel Cell”), has been shunted down to Scandinavia.Whirl Upper gfs_z500_sig_arctic_1

Once I start peeking and prying into the doings of the upper atmosphere I am outside my pay-grade, and basically should either shut up, of simply express wonder and awe, however I will note what I have noted, and that is that when lows roll up to the Pole, Cold gets spilled south, (like water in the Pool a fat guy cannon-balls.) And our mild December has ended here in New Hampshire with our first snow.

Note the high pressure poking up from the Pacific into Alaska, in the above map. On the east side of such highs, arctic outbreaks can roar south. So I want it to go away, and kids want it to grow and bring more snow. So I check the map for midnight, when people in England are all shouting “Happy New Year!!!”Whirl Upper 2 gfs_z500_sig_arctic_10Yuk. Sure looks like that high is building, and the flow will be north-to-south west of Hudson Bay. But maybe Chinook air will get sucked in, or maybe the outbreak will veer towards Labrador and out to sea.

But how about that huge high north of Europe, at this 500 mb level? That may bring mild air to the Pole, but south of it, wouldn’t cold Siberian air start seeping east-to-west? In Europe, an east wind can come straight from Mordor.

WASHINGTON POST HOOP-LA, VS OUR SANE APPROACH 

If you are interested, the hoop-la can be found here:  https://www.washingtonpost.com/news/capital-weather-gang/wp/2015/12/30/freak-storm-has-pushed-north-pole-to-freezing-point-50-degrees-above-normal/

It includes these maps, which I do believe are Dr. Ryan Maue maps, and were lifted from the Weatherbell site without proper credit being given:

I suppose they have to refer to the Icelandic storm as a “freak” to generate interest. It is the same thing as calling it “unprecedented”.  But they are careful to give no links to Weatherbell, or one might get all sorts of historical examples of similar situations with similar storms. That makes everything seem a bit humdrum, and I suppose some think no one will pay any attention if it has been seen before, and is actually used as an analog, to make Weatherbell forecasts.

This is absurd. When an F5 tornado is heading down your street towards your house, it makes not a cotton-picking bit of difference if it is the first F5 tornado ever seen on earth, or the 94,612th.  What matters is your survival, and the survival of those near and dear to you. What matters is what is actually happening. What matters is the Truth.

For the Washington Post to refer to a impressive Icelandic low as a “freak” storm may increase the dwindling circulation of the rag, but anyone who has paid any attention to the North Atlantic knows that, if you call that huge gale a “freak”, then the North Atlantic is full of freaks.  Even the brief period of NOAA records that the Post article refers to notes two storms with lower pressures. And one needs to be cognizant of the fact often the lowest pressure isn’t actually measured, but is estimated by a computer model.

In 1977, when I lived in Maine, I met a man who had served aboard a Liberty Ship during World War Two. Liberty Ships were tough but lumbering cargo vessels that wallowed across the Atlantic, bringing supplies to England under the constant risk of being sunk by German U-boats. They also often got clobbered by North Atlantic Gales. This old man told me the ferocity of the gales was beyond description, as was the way they appeared out of nowhere, in areas where the weather map showed nothing but an innocuous-looking low the day before. They made the Liberty ships wallow nearly 180 degrees, from side to side, and a few ships simply vanished.

Such ships were hastily built and not entirely well-designed, and the man had served on one ship where you could not get from the rear of the ship to the front without crossing a short stretch of open deck. During one stupendous gale he was ordered to come forward by the captain, so he had to cross the open deck. He tried to time his dash between waves, but was staggered by a blast of hurricane force winds and then a wall of unexpected water from an unexpected angle, and then, even though he tried to grip the railing with both hands and knees, was torn from the ship and hurled into the freezing cold water.

He said he knew he was a goner. There was no way the ship could even think of stopping to look for a man overboard (it was not allowed due to the threat of German torpedoes, even if weather made it possible). He looked up the black side of the ship, seeing the dim light of the deck high above, and thought of his young wife back home and his parents and then, very suddenly, he was not looking up at the ships deck, but looking down at it. Then with a slam that broke his arm he was smashed right in front of the doorway to the forward part of the ship, and scrambled through to report to the captain.

This is a good tale because it demonstrates that even the cruel sea has a merciful side. Quite incidentally it also demonstrates humongous gales have raged in the North Atlantic for decades, and the recent gale is no “freak”.

Nor are the above-freezing temperatures surging up towards the Pole “unprecedented.” All you need to do is look back over my notes covering the past two winters to see other examples of warm air surging north.

Not that I don’t think interesting stuff is being revealed to us. It is just that the Washington Post is, I fear, too seduced by the political agenda involved in the Global Warming hoax to see what is actually occurring.

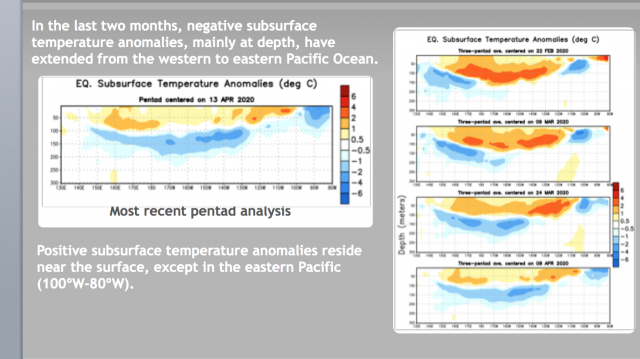
So what is actually occurring? What seems to be happening is unusual cold at the Pole, caused by unknown reasons, is clashing with unusual warmth in the Pacific, caused by unknown reasons.

And yes, yes, yes, I know people like to think they understand the unknown reasons by sticking a name on it. It is like thinking you understand a spaced-out student by calling him autistic. You don’t really understand, but if you call the warm Pacific “the El Nino” or “the Blob”, then you can strut around like a school psychiatrist, pretending he understands the next Winston Churchill or Thomas Edison, when he doesn’t really have a clue.

In like manner, the cold Pole can have a name stuck on it, and be called “due to the Quiet Sun.” And maybe that is a beginning of understanding, but we should not pretend we are authorities when, in actual fact, we are all novices.  We should be more humble.

However the people at the Washington Post apparently do not believe humbleness sells papers. I disagree, but they will not even attempt my approach. I say humbleness sells, but they insist hoop-la sells.  And they are richer than I am, in terms of filthy lucre, so they think they are justified. (I am richer than they can even imagine, in terms of intangible stuff, so I feel I am justified.)

The weather doesn’t care a flying flip about such debates, as far as I can see, and just proceeds on its own path. So…what is actually occurring?

For one thing, a huge amount of heat is being squandered  up at the Pole. The Washington Post may exclaim about temperatures above freezing, fifty degrees above normal, rushing up there, but if you look at the maps I posted above you will see how quickly that heat is lost to outer space. If you watch the maps over the next few days you will see temperatures over the Pole go down and down.

For another thing, the bitter cold that was safely corralled up there is now dislodged south. Big changes are coming to Europe, which are described in detail by Joseph D’Aleo in one of his excellent blogs at Weatherbell. To put his detailed analysis in a nutshell, look at the two maps below, the upper map showing how above-normal temperatures could be in Europe, when the cold was safely corralled at the Pole, and the lower map showing the below-normal short-term future Europe faces, now that the cold is dislodged.Hoop la 3 ncep_cfsv2_80_t2anom_europeHoop la 4 ecmwf_t850a_eur_29What I hope you see is that the Washington Post is guilty of myopia, when it focuses on above normal temperatures at the Pole, without looking elsewhere.

However I do think the surge of warmth north is very interesting, and well worth watching. And I do think that, while me may be novices, there is something to be said by those who suggest we are watching a war between above-normal temperatures brought about by an El Nino clashing with below-normal temperatures brought about by The Quiet Sun.

KEEP AN EYE OUT FOR NEGATIVE AO AND NAO DEVELOPING