ARCTIC SEA-ICE —Pacific To Atlantic Flow—

I’m preoccupied working on my “Manifesto”, and am currently involved studying the madness of the French Terror, and Stalin’s purge of all Russia’s successful farmers, and Mao’s “Cultural Revolution”, because the way some people fanatically insist Global Warming is real despite all evidence presented to them reminds me a little of the Red Guard.

Trying to argue with the Red Guard was a bit like arguing with a Freudian, only rather than seeing everything as sexual they saw everything as political. (Don’t the above gals look lovely? But they couldn’t wear make-up, for either it was evil because it was “traditional’ or was evil because it was western and “imperialistic.”)

Who the heck needs all that? I’m in the mood to run away to the North Pole and just watch sea-ice for a bit.

For a while now there has been high Pressure towards North America and Greenland, and Low pressure towards Eurasia, which sets up a cross-polar-flow from the Pacific to the Atlantic.

This has pulled a feeder-band of milder and moister air from the Pacific up over the Pole.

This is not as dramatic as the surging feeder-bands that came north from the Atlantic last winter, but it has caused a spike in the temperatures north of 80 degrees latitude.

And I suppose this has the Alarmists very excited:

I hate to mention to them that these surges push the colder air from the Pole south, and we in North America are going to be freezing our tootsies off for the next two weeks. So I won’t. Instead I’ll point out some interesting effects this has on the sea-ice. It is moving differently from last year. The south winds have pushed a lot of sea-ice from Bering Sea through Bering Strait and built a wall of thicker ice to the north, towards the Pole:

On the far side of the Pole the south winds become north winds, and push the sea ice south where it was getting pushed north last winter. Last winter there was great excitement among Alarmists when the open water of a polynya opened north of Greenland as the ice was pushed north, and also because there was less ice in Fram Strait and around Svalbard, but this year the ice has come crushing south, flushing through Fram Strait and crunching up against the north coast of Greenland and Svalbard.

The movement of the sea-ice gets me wondering about a couple of things. The first is how open the Northwest Passage will be this summer. It looks like there won’t be much ice in Bering Strait, but I’m a little worried about that wall of ice north of the Strait. It is liable to be chunky and contain piled-up pressure ridges and be slower to break up than usual, and any north wind could bring it to the northwest coast and create an impediment as yachts turn the corner to head east to Barrow.

Barrow Webcam

Once east of Barrow the sea-ice ought break up fairly swiftly, as south winds much of the winter have pushed the thicker ice far out to sea. (The light blue sea-ice is over six feet thick. the vivid blue sea-ice is roughly 3 feet thick, and once the sea-ice gets lilac-purple it is less than three feet.) Down by the Mackenzie Delta it is only around a foot thick, not due to spring floods (as they don’t get going until April) but due to offshore winds. It would take a major shift in the weather patterns to crunch the ice back south to the coast.

As one heads further east next summer there will likely be problems, as the passage east of the Makenzie Delta and south of Parry Channel is very jammed with ice.

Further east, the eastern part of Parry Channel has been surprisingly mobile for the depth of winter, and over the past 45 days a lot of the ice flushed east into Baffin Bay and joined the parade of sea-ice heading south towards Newfoundland, along with a few far larger icebergs that have calved off glaciers. In a sense it seems a reflection of the Pacific-to-Atlantic press. Once again the Canadian Ice Service is noting many icebergs off Newfoundland. In fact this is the fourth winter out of the last six that the “extent” of sea-ice flushing out of Baffin Bay and down past Newfoundland (blue bar) has crept above normal (green line).

Last winter, when Newfoundlander fishing boats became trapped, a young “climate scientist” theorized the increase in ice was due to ice which had formerly been “fast ice” to the north being melted free by Global Warming. The problem with his theory was that the increased levels of ice were getting back to former levels, after ten years of reduced ice (which some had claimed was itself a sign of Global Warming, before the levels recently increased.) Also, way back between 1871 and 1873, the ill-fated Polaris expedition sailed up to the very top of Baffin Bay, and a group of survivors drifted on an ice floe from Nares Strait clear down to Newfoundland in the dead of winter. The sea-ice has always been very mobile.

Image result for polaris expedition 1871

This brings me to the second thing I’ve been wondering about, which involves the effects of an increased export of sea-ice into the Atlantic. This difference between last winter, which saw sea-ice prevented from surging south by “wrong-way-winds” in Fram Strait, (or at least slowed), and this year, when the flow has been assisted by a Pacific-to-Atlantic flow, might assist the study of such effects.

I wonder about this because back around 1816-1817 there was an amazing export of sea-ice south, with whalers noting open water north of Greenland yet icebergs grounding on the coast of Ireland. Some think this may have so chilled the water of the North Atlantic that it lead to “The year Without A Summer” in Western Europe in 1817.

The Arctic Sea must always be exporting sea-ice and very cold water, because it imports water four ways, and can lose little due to evaporation. Even though the Pole receives little precipitation and is sometimes described as a “desert”, air heading north is nearly always moister than the air heading south, which means moisture is left up there. Second, the northern tendrils of the Gulf Stream reach the Arctic Sea, ramming water north. Third, some of the largest rivers in the world pour into the Arctic Sea. (The Lena River is described as “tenth largest”, but I think it may be second or third largest when it is in full flood in August; its water-levels can rise sixty feet.) Lastly, the north-facing glaciers of Greenland and the Canadian Archipelago calve huge bergs.

The export of water occurs in cold currents down the east coasts of Asia, Greenland and Baffin Bay, and the Atlantic receives far more than the Pacific. The water heading south in a liquid form is more dense than warmer water, and at a certain point dives beneath the warmer water. In fact between Iceland and Greenland in Denmark Strait, where the bottom gets dramatically deeper, the cold current plunges down in a manner I have heard described as an “underwater Niagara Falls.” However the sea-ice, (whether the thinner chips of frozen ocean, or huger bergs calved off from glaciers), cannot sink beneath the warmer waters, and instead sails right into the warmer waters, significantly chilling it. Therefore I’ll be watching to see if the Atlantic becomes colder, perhaps influencing the weather in Western Europe.

The ambiguity of the situation is that it is opposite of what some Alarmists suggest. Less ice left up in the Arctic makes it colder, not warmer, to the south. If it chills the Gulf Stream heading north, then, after a lag, it can make it colder in the Arctic Sea as well. I wonder if this fluctuation could play a part in the roughly sixty year oscillation of the AMO.

I’ll be watching to see if there is any decrease in the “volume” graph. Last year, when sea-ice was prevented from coming south, there was an unexpected increase in “volume” that surprised many Alarmists, beginning in February. This year, so far, the “volume” remains above last year, but I’ll be keeping a sharp eye on it.

In terms of “extent” (which means little this time of year, as there still is little or no sunshine to reflect, and “albedo” is not much of a consideration), we may have already passed our winter “maximum”. Alarmists will be dismayed it already beat last year’s (by a hair). Once again the “Death Spiral” is debunked. Not that the facts ever penetrate certain thick skulls.

Stay tuned.

ARCTIC SEA ICE –The Surge Snipped–

The Pole continues to make for interesting theater, though the drama has died down from what it was a week ago, when temperatures were soaring to 35 degrees above normal and the ice at the north edge of Barents Sea was retreating. Fueling this weather was a strong south wind from the Atlantic that at times pushed right past the Pole towards the Pacific, thus confusing everybody, because a south wind became a north wind without changing direction.  This flow achieved its peak around November 14:

By November 16 the flow was pushing an Atlantic low and its secondary up through Fram Strait, whereupon, due to the strict laws of this website, they are automatically dubbed “Ralph”. The southerly flow, while remaining southerly, had swung east, and was now coming less off the Atlantic and more off shore from Europe, but it nearly was able to push above-freezing temperatures to the Pole.

So strong was this flow that the sea-ice, which usually is expanding south as a thin sheet of ice, was pushed north by strong wind until it was briefly well north of Franz Josef Land, and unable to refreeze because temperatures were above freezing in that area. This produced a brief and unusual dip in the ice “extent”graph, which usually is rocketing upwards at this time of year. However the ice swiftly grew back down to Franz Josef Lands’s north coast as conditions began to change, and the graph resumed its upward climb.

dmi4-1123-osisaf_nh_iceextent_daily_5years_en

The surge from the south had raised eyebrows by raising temperatures to unprecedented levels (in a history that goes back 58 years).

dmi4-1116-meant_2016

However my eyebrows were raised by the steep decline that followed.

dmi4-1126-meant_2016

This interested me because, whereas other places can get colder air from lands further north, there is no place north of the North Pole. Therefore it must get cold air imported from colder tundra to the south, but I didn’t see any strong flow from such tundras. This meant the cold must instead be home grown. Or, to put it more scientifically, the heat was lost locally, radiated upwards into the unending winter night.

Still, it seemed odd to me that the warm southerly flow should just turn off like a spigot. My curiosity sought reasons, for the cessation was obvious as early as November 17, because the first and second lows, following a storm track straight north to the Pole, (incarnations of “Ralph”), weakened with surprising speed. It was as if they were cut off from their warm inflow of mild, moist air, while the third storm in the sequence came to a dead halt and refused to head north, and just sat off the coast of Norway and twiddled its thumbs, remaining fairly strong.

I wondered if the stalled low off Norway might be consuming all the available energy, but this didn’t satisfy me, for the isobars in the above map still indicate a strong flow from the south. Why wasn’t the warmth heading out over arctic waters? The temperature anomaly map still showed the above-normal temperatures moving north in central Europe, but then being bent east at the top. What was stopping the import of heat north to the Pole?

surge-7-gfs_t2m_anom_eur_21

I’d likely still be mystified, but dawn broke on Marblehead when I visited Joseph D’Aleo’s blog over at the Weatherbell Site, and during the course of one of his elegant descriptions of complex situations he turned on the light-bulb in my noggin.

Just as a meandering stream straightens its course from time to time, cutting across the neck of a loop and leaving an oxbow lake behind

snip-1-a8dcd06cd8cd3559b399ecc64af3a2032812ccf0

So too can a loopy jet stream decide to straighten up its act, and the “surge” was part of a loopy jet:

snip-2-screen_shot_2016_11_23_at_5_15_03_am

When a jet straightens up it act, the cut off part of the stream is not called an “oxbow”, but rather a “cut off”, (which shows that meteorologists are occasionally more sensible than geologists).  By November 23 the upper air maps showed the “cut off low” was sitting down over Spain. Over Spain a large part of the surge was no longer heading north, but caught up and going around and around and around, like a taxpayer caught up in a bureaucracy.

snip-3-ecmwf_uvz500_eur_5

You will notice that at the top of the above map the jet is basically zooming west to east. The surge from the south has vanished, making a mess of all my forecasts that calculated the surge would move east this far one day, and this far further east the next. The surge simply disappeared, or at the very least fell over and surged west to east. It was confusing. (Actually the same thing happens when I straighten up my own act. It confuses people who depend on me to be loopy.)  In any case, this morning’s surface map had a reflection of the cut-off-low stalled over Spain, but what about the North Atlantic low? It will plow west-to-east across Scandinavia in the jet, nothing like the lows that headed straight north, last week.uk-met-20161126-42268142

The tipped over surge can be seen giving some relief to central Asia in the temperature maps.

snip-4-gfs_t2m_asia_2

In the anomaly map the west-to-east surge looks like an arrow, making a layer cake out of the map (to mix my metaphors). The old cold is to the south, still capable of generating a few headlines, but likely to be slowly moderated out of existence. The new cold is along the top, and likely needs to be watched, for it seems likely to be a lasting feature. The “surge” itself seems likely to linger but weaken, but will remain interesting to watch.  At the very least it will give some Asians a break, after they have been through an autumn colder than some winters.

snip-5-gfs_t2m_anom_asia_2

But this is all off the point, which was (in case you can’t remember), that the mild air is not surging up to the Pole any more, and that the vast pool of mild air that was transported up there is slowly cooling, day by day.

I should note that Joseph D’Aleo mentioned that when a jet really gets roaring west to east it can act downright human. (After humans have straightened out their act, what tends to happen next? Answer: Their resolve buckles.) In like manner, we should be on our toes, watching for where the jet will next buckle, and get all loopy, (like a human falling off the wagon after keeping a New Year’s resolution as long as they can bear it).   However, for the time being, up at the Pole, “Ralph” has little hope of reinforcements from the Atlantic.

Not that “Ralph” has vanished completely. Largely he has retreated to the Canadian Archipelago, as high pressure dominates the Arctic. At the end of my last post there actually was a small ghost of Ralph by the Pole, and hint of Ralph’s “signature” in the temperature map, hooking mildness towards the Pole, despite the power of the expanding high pressure. (See the tiny low by the Pole?)

The next day Ralph’s ghost was just a dent in the high pressure’s isobars. Freezing temperatures had snuck down to the northeast coast of Svalabard.


The next dawn Ralph, like all good ghosts, was vanishing, because that is what ghosts do at dawn. (If you you squint you can still see a microscopic low under the Pole.) The only real import of air towards the Pole was from central Siberia.

The following dawn saw an odd dimple in the high pressure’s isobars, on the Canadian side. It looked like (if you use your imagination) a face, that the ghost of Ralph had punched. Freezing temperatures were engulfing Svalbard. By evening the ghost of Ralph reappeared, (as good ghosts do at dark), just north of the Canadian Archipelago.

Today saw the freezing isotherm slump well south of Svalbard, and Ralph retreat and regroup north of Canada. Models are suggesting Ralph will soon start attacking the Pole from the Canadian side, though with colder air than before. The North Atlantic flow is totally from the north, and Scandinavia looks likely to get a dose of north winds.

The north winds are allowing the sea-ice to build south again where the “surge” had forced it to retreat, in the north part of Barents Sea, and sea-ice is again touching the north coast of Franz Josef Land. There was also a slight reduction on the Pacific side, due to strong south winds and a brief mild inflow a week ago, but that has been more than made up for by regrowth, which has now engulfed Wrangle Island.

concentration-20161125-attachment-1

A major difference from last year is that Hudson Bay was half skimmed-over last year, and the refreeze hasn’t even started this year. I think this will soon change. The Bay’s waters are shallow, and it tends to freeze over with remarkable speed, which contributes to the speed of the growth of the “extent” graph.  I’ll bet a nickle the Bay is entirely frozen by Christmas.

Even though the flow from central Siberia has been weak, it appears to have nudged the thicker ice just off shore, in the Laptev Sea. Watch for the formation of polynyas along the shore there, for that is indicative of the export of ice into the Central Arctic Basin.

Baffin Bay is swiftly icing over, but remains behind last year’s rate of growth..

The Kara Sea’s sea-ice shrank back before the “surge”, but that sea has since swiftly grown sea-ice on its eastern side.

The reversing winds have seen multi-year ice start down through Fram Strait, along the east coast of Greenland, but the ice down towards the coast opposite Iceland in Denmark Strait is largely home grown.

thickness-20161125-attachment-1

I’m not sure how it is possible, but some models see a colder version of Ralph moving up from Canada to regain complete control of the Pole in a week to ten days. Stay tuned.

ARCTIC SEA ICE –A Changing Pattern–(Updated Sunday Night)

The DMI maps are available again at long last, and seem to indicate the low pressure over the Pole is filling in, and the cold is starting to rebuild.                          DMI3 0122 mslp_latest.big DMI3 0122 temp_latest.bigDMI3 0122B mslp_latest.bigDMI3 0122B temp_latest.big

Deep low pressure continues to stall between Iceland and Greenland, creating a southerly flow up through the North Atlantic, but the associated fronts and lows aren’t making the same progress past Fram Strait towards the Pole. The UK Met maps show the current storm weakening as it crawls from Denmark Strait up to Fram Strait, as a new Gale replaces it by midday Sunday down in Denmark Strait. Note all the fronts occlude and tangle to the north, failing to progress north. (Click maps to clarify and enlarge.)

UK Met 20160122 31143270 UK Met 20160122 2 day for 31146915

The Atlantic flow is expected to slowly collapse south and east, until it pours across Northern Europe.  (Jospeph D’Aleo has an excellent post about this shift at the Weatherbell Professional Site.) This will squeeze the cold currently over Europe back down over poor, snowbound Turkey (and any Syrian refugees) and then down to the Middle East, as western Europe gets a break from its current cold, and even may get some rain, but eastern Europe and Russia gets yet more snow. This developing spear of milder temperatures shows up especially clearly in Dr. Ryan Maue’s Canadian JEM model map for temperatures next Monday.DMI3 0122B cmc_t2m_asia_11It is not particularly “warming” to increase the Siberian snow-pack, which has been generating a copious supply of cold air this year. It’s to be hoped that the spear of mildness is bent southeast down to Mongolia, which has been suffering bitter cold, as the cold generated over Siberia’s snows escaped south towards China. The excellent researcher and contributor the Ice Age Now site,  Argiris Diamantis, found this press release about Mongolia’s plight, (which I haven’t seen mentioned in the mainstream media):

 Disaster Relief Emergency Fund (DREF) to support Mongolian herders facing severe winter. Published: 19 January 2016
The International Federation of Red Cross and Red Crescent Societies (IFRC) has released 158,000 Swiss francs (157,686 US dollars) from its Disaster Relief Emergency Fund (DREF) to assist 1,500 herder families (7,500 people) in Mongolia who are at risk of losing all their livestock to extreme sub-zero temperatures and heavy snowfall.
Based on the latest assessment report released by the Mongolian Government in early January 2016, 50 soums (districts) in 16 aimags (provinces) are currently categorized as being affected by dzud (the Mongolian term for severe winter conditions), while 120 soums in 20 provinces are facing a winter situation that is very close to dzud.
Snowfall and snowstorms are expected to continue unabated in the coming weeks with average temperatures of below -25 degrees Celsius during the day and around -40 degrees at night. This will potentially affect more than 965,000 people, especially vulnerable herders. The herders, most of whom are now facing difficult weather conditions and shortage of hay and fodder, are expected to start losing their livestock in the coming weeks. In order to obtain cash to buy food, hay and other necessities many herders have started selling their animals before they perish in the severe weather. However, the oversupply of livestock resulted in very low market prices, forcing herders to sell at abnormally unfavourable prices. This situation will have the worst consequences for vulnerable families with smaller herds.

(From http://iceagenow.info/17683-2/#more-17683 )

(This sad situation introduced me to a new word, “dzud”, which is a Mongolian word for the mass death of livestock.)

Besides the cold air escaping south, it is pouring east into the Pacific, giving Korea its bitterest cold of this winter, and speeding the freeze of Pacific coastal waters to the northeast, the Sea of Japan and especially the Sea of Obhotsk further north. These waters, outside the Arctic Ocean, have had below-normal-sea-ice so far this winter, and are one reason the ice extent graphs show “less than normal” ice. (Map from Wikipedia)240px-Sea_of_Okhotsk_mapWhile ice in these waters likely has a part to play in the intricate engineering of the PDO, it is likely wrong to put too much weight to the up-ticks in the extent graphs any increase here might create, (especially as ice on Chesapeake Bay and Delaware Bay were not included in “sea-ice extent graphs” last winter.) Also, in terms of the reflected sunlight and “albedo” equations that mean so much to some Alarmist theories, the amount of snow over Siberia (and Canada) should be factored in, as it far exceeds this possible increase of ice, but the albedo of snow-pack often isn’t included.

The thing I’m noticing more and more is how Siberia generates cold air masses, and what a huge factor this is all over Eurasia, and even across the Pole in Canada. Siberia is a gigantic region, and even the snow currently blocking the mountain passes in the North African nation of Tunisia can be traced back to the Steppes.

In any case, to return from Africa to the subject of the Arctic Ocean, some of the Siberian cold seems to be pouring north, and I am going to be keenly watching to see if the temperatures up at the Pole take a dive, after being relatively high during the time Atlantic air was flowing up that way. (The DMI has finally posted a new graph, for the mean temperatures north of 80 degrees latitude.)DMI3 0122 meanT_2016While temperatures have been as much as ten degrees above normal at the Pole, it should be noted this is no heatwave, and represents a mean temperature of -20C, at the “mildest”. This is “below zero”, for people like me who use Fahrenheit, and quite obviously no melting has been going on during this “heat wave”, (except for a brief thaw on the Atlantic side, that lasted only a matter of hours.)

I will also be keenly watching to see if a rebuilding of cold at the Pole is accompanied by a break from the cold, a so-called “January Thaw”,  further south. As it is, when milder temperatures push north colder temperatures seem to be pushed south, and, even as I write, a nor’easter is blowing up on the eastern coast of the USA, creating quite a hubbub, as the snows are falling further south than they did last winter, and Washington D.C. is getting clouted.

In a sense it seems to me almost as if the Arctic is breathing. It breathed cold out, and had to breathe warmth north to replace that cold, (or perhaps vice-versa). Now it is breathing the other way. The cold is refilling the Arctic Sea, but likely will be again exhaled, leading to the next outbreak of winter storms.

Spring seems a long way away, but we are currently at the depth of the cold, the bottom of the bottom. The coldest surface temperatures are usually around January 20, down where I live in New Hampshire, and the coldest temperatures aloft occur around February 1. I even saw a true sign of spring today, which was the first advertisement by “Quark Expeditions”, for people like me who would like to travel up to the Russian Barneo Base, a yearly airbase (and military exercise) that exists for roughly 45 days on the sea-ice at the North Pole. (Unfortunately I lack the $15,000.00 needed for a ticket, but surely some good reader will fund my research). (I want to meet and interview the fellows putting up next year’s North Pole Camera.)

http://www.quarkexpeditions.com/en/press-releases/2015/02/north-pole-land-or-sea-barneo-ice-camp-and-icebreaker-expedition-voyage-0

The sea-ice will keep expanding at the edges for another month, and in some areas the ice keeps growing thicker right into the spring, so there is still much to watch. Besides watching to see if there is late growth in below-normal Pacific areas such as the Sea of Okhotsk and Bering Sea, it will be interesting to watch the below-normal parts of Barents Sea on the Atlantic side, especially around Svalbard.Concentration 20160120 arcticicennowcastOf course a lot concerning the ice is very difficult to gauge. Is the ice tortured by storms, and crammed into pressure ridges? Is it thinner, due to greater snows acting as a muffler? The Navy’s thickness map attempts to measure this, but has some shortcomings.Thickness 20160121 arcticictnowcastOne thing I’ve noticed about the thickness map is that it can’t really tell you whether or where the ice will or won’t melt in the summer, as that is partly caused by where the ice moves, and also is dependent on the temperature of the water moving in, under the ice. Water temperatures are important, and it is great fun trying to figure out what the oceans are up to.

One of the most important factors in the flow of the currents involves the antics of the AMO and PDO, so I try to watch what they are up to

The AMO is still staying up in its “warm” phase (whereas last year it was taking a dive, in January). AMO January amo_short

The Pacific, on the other hand, seems likely to become colder, with the El Nino starting to fade, the so-called “Warm Blob” looking less robust, and the PDO starting down.PDO January pdo_short

One thing becoming apparent to me, as I try to fathom something as huge as even one of the oceans, is that the sloshes represented by the AMO and PDO are brought about by some mighty big butts in the bathtubs. Things such as the magnificent moods of the Sun, and the bigger volcano eruptions, can take a nice predictable cycle and knock it all out of whack. As I look back in time I can see all sorts of evidence of a sixty-year-cycle, but also times when a world shaking event, such as the eruption of Tamboro in 1815, threw some cannonballs into the bathtubs, and added sloshes to the sloshes. Considering some of the ocean’s up-wellings contain waters that are over a thousand years old, I wonder if some events occurring now had origins in calamities that occurred to Earth a thousand years ago. My sense of wonder grows and grows, the more I study.

One small comment at the end of a recent post by Joseph D’Aleo really got me thinking. He mentions, in an off-hand manner, “In upcoming winters as the sun goes into its deep slumber including geomagnetic activity which has a cycle that trails the sunspot/flux cycle, expect more persistent cold and the return of record snows further west as the AC/NAC become very negative. High latitude volcanoes seem to get more active in these periods and they help enhance blocking in winter and the cold.” (My bold).

I found this statement a bit disconcerting, because it exposed my own dismissal of the idea the Quiet Sun could have any effect on things such as earthquakes and volcanoes. I just took a practical view that sunshine might effect the temperature of the air and the surface waters of the sea, but sunshine couldn’t cause the continental plates to shift or volcanoes to explode. Sunshine just plain didn’t seem strong enough.

However I dismissed this idea without bothering to investigate the idea or look at data. Considering I’ve spent (and perhaps wasted) ten years investigating whether trace amounts of a trace gas could have earth-shaking consequences, including boiling oceans and the extinction of the human race, it doesn’t seem fair that I dismissed another idea off hand. But I confess: I did exactly that.

My study of the trace gas CO2 has taught me an amazing amount, and I am far more aware of its effects than I formerly was. Formerly I was only aware of CO2 when tried to see how far I could swim under water, and the CO2 levels in my blood told me it was time to come up for O2. Now I know all sorts of fascinating trivia. For example the CO2 levels in my garden spike during the night, when no photosynthesis is occurring, while a lot of fungus is contributing to a lot of CO2-producing rot. Therefore most of the plants in my garden rejoice at dawn, for the CO2 levels are at their peak, and they do most of their growing just after dawn, when the air is rich with CO2. Within a couple hours the CO2 levels plummet to levels so low plants can barely grow, due to the frenzied phtosynthysis of daybreak.

Now I ask you, isn’t that some interesting trivia?

However, in terms of sea-ice, try as I would, I could find no great effect from CO2 levels. Nor was there much effect from even sunshine, though it was obvious sunshine twenty-four hours a day did have a greater thawing effect than CO2.  Yet most of the effects on the amounts of sea-ice were caused by winds, and by currents of water under the ice.

Winds and currents can at least be attributed to the levels of sunshine reaching the earth, and I struggled to see CO2 might be the fausett turning on and turning off those levels of sunshine, but in the end it was too great a stretch to look at CO2, and not look at the sun itself, as the determiner of the levels of sunshine.

However it is one thing to see the sun as influencing winds and currents, and quiet another to see the sun as influencing earthquakes and volcanoes. Therefore I found Joseph D’Aleo’s comment  unnerving, because if anyone has sifted through the available data, it is he. Maybe he couched his language and used the word “seem”, when he said “High latitude volcanoes seem to get more active”, but when he stops to look at something, it gives me pause.

It was especially disturbing because of another thing I’ve been dismissing. That is the idea that undersea vents may contribute to the melt of sea-ice. I’ve seen creatures by those deep sea vents living quite happily in spitting distance from water so hot it only was kept from exploding into steam by enormous pressures, and if heat couldn’t even cross that short distance, I didn’t see how it could get to the surface.

But wouldn’t you just know it? The very day I read Joseph D’Aleo’s remark I came across this map:

Vent melts sea ice fig1_arctic

It was an illustration for this post:  http://www.climatechangedispatch.com/heat-from-deep-ocean-fault-punches-hole-in-arctic-ice-sheet.htm  .

I began to think: If the Quiet Sun could increase high latitude volcano eruptions, could it not increase high latitude undersea eruptions?  And could that not increase the melting of ice from below, even as the Quiet Sun made things colder and increased the ice from the top? And what sort of butt would this stick into the sloshing bathtubs of the PDO and AMO?

What a hideous complication!  But what a wonder to wonder about! (Don’t get me wrong; I am far from arriving at a firm conclusion, but I sure am wondering).

It makes me feel so sorry for the Alarmists who are so insistent upon CO2 being the one and only reason, for absolutely everything, that they never open their minds to the possibility of anything else. What a narrowness they live in. It must be like living in a crack.

UPDATE  —SATURDAY NIGHT—

I should likely note that the Camera Fabootoo is still producing pictures of darkness, and that the co-located Buoy 2015D is reporting another slight thaw, with temperatures of +0.16°, as pressures have plunged to 983.07 mb. Likely the winds are roaring. We are at 72.31° N, 17.03° W, which means we have moved 244.22 miles south-southwest since December 30. We are now closer to Denmark Strait than Fram Strait, and nearly as far south as the small, isolated  Norwegan Island of Jan Mayen, to the east.

The DMI maps show a weakening low crawling up the east coast of Greenland. The cold is building in the Arctic Sea, but an interesting tendril of milder air is extending up over the Pole from Svalbard, causing a noodle of low pressure north of Greenland.

SUNDAY NIGHT UPDATE –Cold To Be Dislodged From Pole Again?–

Today’s DMI Maps continue to show the cold building up over the Arctic Sea.

However it appears this cold will be pushed off the Pole by new invasions of both Atlantic and Pacific air. Look at the Canadian Jem Model’s solution of what the temperatures will look like on Tuesday, up there. You can see the intense cold in East Siberia, and cross-polar flow to Canada getting squeezed by tendrils of milder air from both Oceans.DMI3 0124B cmc_t2m_arctic_9While looking at a NASA video of the blizzard that hit Washington DC my eyes were drawn, (because I’m a true sea-ice fanatic) to the upper right, to watch what was occurring in the North Atlantic. You can see a couple of very impressive surges heading straight for the East Coast of Greenland.

It looks to me as if it will stay “warm” over the Pole, with a meridenal pattern locked in. If it keeps up, it will be interesting to see what the long-term effect on the sea-ice is. I’ll make no predictions.

The effect on the media is more predictable, for those eager to find “evidence” of a melting arctic are bound to notice if it stays above normal in the Arctic Ocean. They will be all the more delighted if there is any sort of dip in the amount of sea-ice, which is something I myself would not be terribly surprised to see. But I will be considering whether it indicates things other than a “melting arctic”.

For one thing, having so much heat rushing to the Pole seems like it might be in response to the El Nino releasing heat and moisture. To have it rushing to the Pole is like warmth from your living-room rushing up your chimney.  It is a waste of home heating, with “home” being planet Earth. It would be far more efficient if the “damper was shut”, and a zonal pattern kept the winds circling around and around the Pole, with the cold locked up in the north, and the warmth hoarded further south.

Another thing to consider, and watch for, is the consequence of warm air rushing up to the Pole, which tends to be the cold getting dislodged and snows getting deep in places where it usually doesn’t, such as Washington DC and Turkey. Even though snows in southern latitudes tend to melt swiftly, and be gone by the end of February, they cannot have a “warming” effect while they last, especially when you consider the “albedo” of freshly fallen snow is huge. In terms of the “energy budget” (that Alarmists like to pretend we understand, and I don’t),  snow over areas that do get sunshine is bound to reflect more sunshine than a lack of sea-ice over areas that are under 24-hour-a-day darkness is liable to fail-to-reflect.

Once the sun starts coming north all these calculations will get more interesting, for then there is at least a chance of open waters absorbing some sunshine. However that won’t be until March.

Everything is likely to change very much by summer, because the El Nino is expected to fade fairly rapidly. Even if you include “lag time”, the very thing that may be fueling the current situation may vanish by next autumn, when a La Nina may be setting in. Just around the time I get things figured out, they are likely to completely change. To use the analogy I used above, a La Nina is like a cannonball plopping in the bathtub. I guess you can see why I am reluctant to venture a prediction.

I prefer to simply watch and wonder, so that is precisely what I intend to do.

ATLANTIC AIR HEADING TO THE POLE AGAIN

We seem to be switching back to the former pattern, so I figure this post about the “new pattern” is already obsolete, and it is time to start another post. For the record I will state that we have seen a break in the flow of arctic air, during the brief time it has been held up at the Pole, but I suspect the new post will watch the arctic wolves again starting south.


ARCTIC SEA ICE —Typhoons Effect Sea-ice—(August 27 – September 3) (Concluded.)

I am in catch-up mode, because business has to come before pleasure and sometimes I don’t have time to do justice to the ongoing story of this year’s sea-ice melt. Sorry if this report seems sloppy.

There have been some huge and (from afar) beautiful super-typhoons rolling towards China and Japan in the Pacific, and then curving north, which is typical of El Nino situations. I haven’t been paying proper attention to them,  as I have only so many brain cells left after a misspent youth,  and they get used up attending to mundane stuff. After all, I can’t be everywhere and pay attention to everything.

Just because I can’t pay attention doesn’t mean I can’t (in a sense) delegate attending to others. I don’t have to pay these delegates, for often they don’t even know they are attending for me.

An example of this involves my goats. I might be taking them out for a walk to a place where they can chow down on something they like, such as acorns, and my mind may be engrossed in significant things (such as thinking up a word that rhymes with “typhoons” to put in this post’s title), however I keep an eye out for any sign the goats are noticing something I’m not. Often they do, and alert me to things I’d never notice: A fox in the distance, or the signs in the dirt that a bear also likes acorns, and has been by recently.

Actually that is a lousy example, because it makes it sound like I am calling a brilliant meteorologist a goat. (I am always accidentally offending people with impudent innocence.) However when Joseph D’Aleo pauses to scrutinize a typhoon on a map at his Weatherbell site it is in some way like when my goats stop to scrutinize something I don’t see. It wakes me up to the fact I’m missing something.

These typhoons aren’t quite behaving the way El Nino typhoons are suppose to behave. They are suppose to translate into huge north Pacific gales that roll into the Gulf of Alaska. Instead they run aground off Kamchatka. Dr. Ryan Maue’s maps from the Weatherbell site are showing it happening yet again.  High Pressure gets in the way, and the gale that develops in the Gulf of Alaska is not directly related to the typhoon, although teleconnected. The typhoon is blocked from curving east.

TODAYTyphoon 0 gfs_mslp_uv10m_npac_1  TOMORROWTyphoon 1 gfs_mslp_uv10m_npac_5  FRIDAYTyphoon 2 gfs_mslp_uv10m_npac_9 SATURDAYTyphoon 3 gfs_mslp_uv10m_npac_13 SUNDAYTyphoon 4 gfs_mslp_uv10m_npac_17

The energy of the blocked typhoon may blurb over the top of the ridge using mysterious powers of teleconnection, but to a bumpkin like me it seems a lot of the actual moisture and convection cannot make it east, and comes north towards us at the Pole. In fact I have a hunch the low northeast of Bering Strait in the first map is left-overs from a similar blocked-typhoon situation a while back, and even as this low fades in the Bering Sea, we should expect a copy to evolve from this current typhoon in ten days.

In any case quite a ruckus is going on on the Pacific side,  and I think it may be pushing Polar weather over to the Atlantic side. I think I’ll name the low in the Beaufort Sea “Ruckus”.

FABOO REPORTS

On Monday Faboo dawdled around the same spot until noon, and then began inching south, while constantly drifting west, ending the day at 86.190°N, 12.717°W, which is 2.68 miles the wrong way (west) if we want to get to Fram Strait. However the real news was the temperatures, which crashed from a high of -1.0°C at midnight to a low of -4.9°C at 0600Z, and only could recover to -3.3°C at 1500Z before ending the period at -4.1° Cat 2100Z.

Yesterday Faboo continued southwest to 86.168°N, 13.157°W., which is 2.53 miles from where we started. Unless we work back east there remains the slight chance we will be the first North Pole Camera ever to get sucked into the Beaufort Gyre. Temperatures remained cold, dropping to -5.0°C at 0500Z, which is the coldest we’ve seen since Spring. After that there was steady warming, but only to -2.9°C at the final report. Judging from unofficial reports, we could soon go a week without thaw.  (Remember that it takes time for the cold to chill downwards through four feet of ice. As cold as it is, the underside of the ice is not yet reached by the cold, and is still melting away.) Up on the top, all Faboo can see is cold landscape with no signs of thaw.

NP3 1 0826 2015cam1_7 NP3 1 0826B 2015cam1_1

O-BUOY 9 STARTING SOUTH

It may look like the buoy is hesitating, but I think it is too far gone to stop now.Obuoy 9 0826 latitude-1weekWith temperatures crashing to -5°C, I once might have thought the buoy could be frozen to a standstill, but such things do not happen in Fram Strait. It could be -20°C and still the ice surges south. Obuoy 9 0826 temperature-1week The pictures remind us we are not talking about a stable icecap. We are talking about a stormy sea.Obuoy 9 0824 webcam Obuoy 9 0824B webcam Obuoy 9 0825B webcam Obuoy 9 0826 webcam

BEAUFORT BUOYS HIT BY RUCKUS

Ruckus could be our “summer gale” this year. O-buoy 10 is showing signs of the ice breaking up. The first image shows a lead opening up below the horizon to the left, as the camera stops moving south and lurches north in south winds.Obuoy 10 0823B webcamThe next image sows signs of thawing in the south winds.Obuoy 10 0825B webcamThe next image shows the sun actually sets, south of 80° latitude, but Ruckus has brought south winds of 20 mph and thawing.Obuoy 10 0826 webcamThe final image shows our camera has swung around counter-clockwise slightly in its private melt-water pool, as thaw continues.  Ice break-up seems near at hand to me.Obuoy 10 0826B webcam

O-buoy 11 also has experienced 20 mph winds and thawing, but rather than ice being dispersed and melted the buoy has traveled north back into the pack ice. Wind have recently dropped, along with temperatures, towards calm and freezing.Obuoy 11 0824 webcamObuoy 11 0825B webcamObuoy 11 0826 webcamObuoy 11 0828B webcam

O-buoy 12 may have run into trouble, as winds increased to gusts likely of gale force and temperatures that dropped below freezing. It too was pushed north to pack ice, but then lurched south. The camera is currently blank, and the weather information delayed, but the GPS still is working.Obuoy 12 0824 webcamObuoy 12 0825CObuoy 12 0826 webcam

Obuoy 12 0826B webcam

Maybe it just got really, really foggy. Not that I’d mind all that much of O-buoy 12 was sunk. It has been making me look bad all summer. Not that it is all that hard, considering even my goats see things I miss.

With the typhoons jamming up south of Bering Strait, I really should have seen this storm “Ruckus” coming. The only good I can see in the situation involves the fact I’ve thought of a word that rhymes with typhoon.whatamaroon

O-Buoy 12 Flattened.

The screen continues to show white, but perhaps the pitch and roll graphs tell the story:Obuoy 12 0827 pitch-1week Obuoy 12 0827 roll-1week

Unless the heavy seas somehow broke the keel off, these buoys are designed to bob back upright when flattened in open water. Therefore I surmise open water is not involved. This seems an incident of titanic proportions. (Ha Ha) Some collision with sea ice seems likely, which seems an odd fate for a buoy some maps show as being in open water.

DMI MAPS

One accidental benefit of falling behind is that I get to see these maps as more of a sequence, and can spot progressions more easily.

DMI2 0825 mslp_latest.big DMI2 0825 temp_latest.big

DMI2 0825B mslp_latest.big DMI2 0825B temp_latest.big

DMI2 0826B mslp_latest.big DMI2 0826B temp_latest.big

DMI2 0827 mslp_latest.big DMI2 0827 temp_latest.big

The big news in these maps is the arrival of Ruckus from the Pacific, however Dawdle south of Iceland may also be interesting to watch, as it may develop a secondary on an occluded front north of Norway on Sunday, and that secondary may in turn develop a secondary on its occlusion that makes a charge for the Pole next week. The high pressure “Hichuk” over the Pole is getting it from all sides, and likely will fade. In fact we are seeing a pattern switch.  I suppose it was to be expected, for when you build a nice cold pool over the Pole it is bound to fuel some action.

O-BUOY 10 EXPERIENCES ICE BREAK-UP

It broke up in a hurry, once it got started, likely due to the winds of Ruckus pulling the ice in different directions. Obuoy 10 0827B webcam

O-BUOY 12 FACE PLANT

The fact the picture is different at all is a good sign, though I’m nervous those thin lines might be a broken lens. The “roll” is still at 90 degrees, which suggests the buoy is horizontal and taking a break. (Someone tell the boss.) I imagine it is looking up, due to the brightness of the picture. There is still no readout from the weather instruments. Obuoy 12 0827B webcam

THURSDAY FABOO REPORT

Yesterday Faboo continued south and west 4.77 miles to 86.124°N, 13.952. Temperatures continued cold with the “daytime” high -3.7°C at noon, and the low -5.6°C at 1800Z.  Unofficial reports suggest we have continued the southwest motion and cold temperatures today as well, with a dusting of snow. As the Pacific side gets bashed apart by “Ruckus”, the Atlantic side looks as solid as rock.NP3 1 0827 2015cam1_3 NP3 1 0827B 2015cam1_1

O-BUOY 9 REPORT

Light southwest winds are drifting us back north and east, as temperatures climb back up towards freezing. This buoy, at least, is seeing some nice weather. Hopefully the sun will melt the slush from the right corner of its eye.Obuoy 9 0827 webcam

O-BUOY 11 REPORT

O-buoy 11 is experiencing lighter winds, and has stopped drifting north and drifted south slightly, as the calmer center of “Ruckus” passes. Temperatures are just above freezing.Obuoy 11 0827 webcam

I apologize in advance for the fact postings may be sparse over the next few days due to the fact I am busy and also need to post from a foreign computer, as this old, faithful pile of junk needs work.

SATURDAY CAMPGROUND REPORT

I am taking some time off, but before I go fishing in a lazy, sandy-bottomed stream I figured I’d see what is possible with an alien laptop.

Well, that took too long.  It shows Ruckus is still wreaking ice in the Beaufort Sea, and Dawdle has kicked  Dawdleson up towards Norway to lead an attack on the Pole from the Atlantic side. Hichuk sits on the Pole like an officer who thinks he is directing traffic but who is about to be run over.

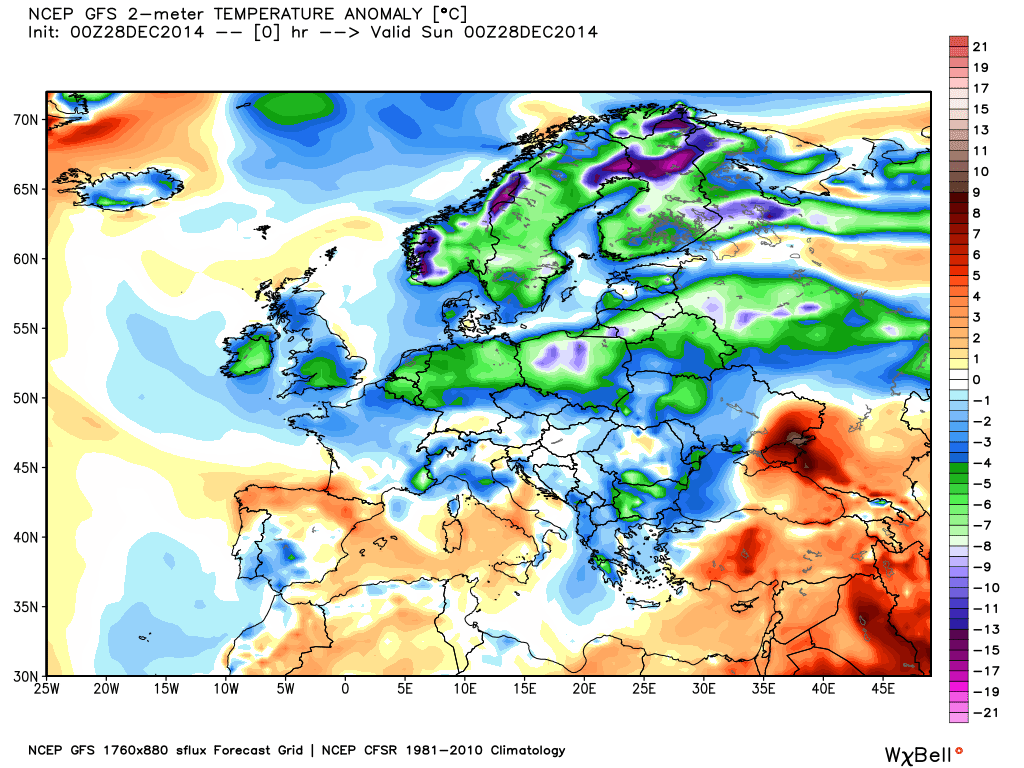
The temperature map shows Ruckus lifting mild air up over the Pacific side, and mild Atlantic surge fighting north over Scandinavia. Less obvious are the outbreaks of Polar air, which I can’t emphasize without access to Weatherbelle and Dr. Ryan Maue Maps.(This alien computer requires a password I can’t remember off the top of my head.) I do remember East Siberia was colder than usual for this early. When warmth invades the Pole there is always cold blurbing south somewhere else, if you look for it.

Before I go fishing I am going to try to download an essay on rotten ice that insomnia allowed me to write

WHEN ICE CAN’T BE TRUSTED

I did say it looked like the ice O-buoy 10 rode on appeared likely to soon break up, and it did promptly break up, so I figure I deserve a pat on the back for that. I don’t get things right all that often. The thing that puzzles me is why it was such an easy call. It is not enough to simply say that I have spent years walking on ice in New England, and that, in the spring, a day comes when you eyeball the ice and simply don’t trust it any more. That isn’t science. That is experience.

A couple of times I have been curious enough to walk on the Ice when I no longer trusted it, making sure to do so in shallow water I could wade in. It seemed the ice lost its structural integrity. It goes from being a solid block to being many small crystals with the consistency of corn snow. As boys we noticed this spoil the ice hockey during a January thaw, though in that case it was only on the surface, (and it didn’t keep us from playing and winding up sopping wet).  It is when the ice reaches a certain temperature from top to bottom that you simply cannot trust it. It then becomes what some call “rotten ice”.

There are scientific instruments that take the temperature of the sea-ice from top to bottom, and it is interesting to see the changes the ice goes through.

In the dead of winter it is usually coldest at the top, and warmest at the bottom. At the top, when blown free of snow, the ice can be nearly as cold as the winter winds, which can get down to minus forty at the center of the Pole, an colder where winds roar off the tundra. At the bottom the ice is at the freezing point of salt water. The heat is constantly moving upwards through the ice, but when the supply is less than the demand the ice get colder, even at the very bottom, which is why it is able to freeze the water it is floating on. The only exception to this rule is when winter storms suck milder air north over the ice, and then the ice briefly experiences springtime conditions.

In the spring the ice increasingly may be colder than the air blowing over it. At first the ice may be at -30 and the air at -20, in which case, down at the bottom, the supply of heat in the seawater is still too small to meet the demand from above, and the ice keeps expanding downwards, even though the ice is starting to be “warmed” from above.

As time passes the air above the ice warms until, while still below the freezing point of salt water, a profile of the ice shows a sort of sandwich, with the coldest ice in the middle. The exact point at which the ice at the bottom stops growing and starts shrinking involves nuance of thermodynamics I don’t claim to understand, but the tipping point seems to have more to do with the temperature of the middle of the ice than what is happening up at the top. It also matter whether the water is coming from a warm source or not. I have seen ice grow at the bottom despite thaws at the surface, and ice shrink at the bottom despite flash freezes at the surface.

It always seems to take a long time for thaw season to begin, as heat must move down to warm the ice beneath. Also the heat moving up from the bottom reaches a point where its supply exceeds the demand, which does not necessarily show as the bottom melting, but will show as the ice in the middle being warmed from beneath. The sandwich-effect fades in the ice profile, as the middle-ice is warmed from both above and below, until the ice arrives at the “rotten ice” stage, where it is at the freezing point from top to bottom.

Whether that “rotten ice” then breaks up or not depends most on whether it experiences calm conditions, or strong winds, and also whether the wind converge, pressing the ice together, or diverge, spreading the ice apart. To a lesser degree it depends on whether the refreeze can create enough of a crust on top of the ice to increase the structural integrity. This is not so easy to do, and I have observed ice break up even after the refreeze was well underway. Lastly, the break-up is more likely if the water under the ice is warmer than usual due to the “warm” phase of a PDO or AMO.

The break-up of O-buoy 10 seemed likely because it was moving south into relatively open water (diverging) and that water was warmed by the “warm” PDO. That break-up was delayed but not denied by flash freezes and calm conditions. When thaw resumed and winds increased, the ice disintegrated swiftly. It had met the criterion for structural weakness.

Faboo has not yet met that criterion, and remains the only buoy left on sound ice. Until (and unless) Faboo moves down into Fram Strait that ice is likely to remain firm, though the Atlantic is now hurling some late-season  challenges north.

FABOO REPORT   Westward Ho!

The above graph demonstrates how the bottom melt continues despite a solid week of very cold conditions at the surface. It will take a while for the cold to penetrate to the water, however the surface is likely  firmer, and any open leads between floes will be freezing over. 

Faboo has continued to creep south and slide west. Thursday’s report had us move 6.31 miles southwest and reach 86.062°N,14.940°W,  and  Friday’s had us move 5.10 further southwest and wind up at  86.026°N, 15.890°W. 

FABOO SOUTH OF 86 DEGREES

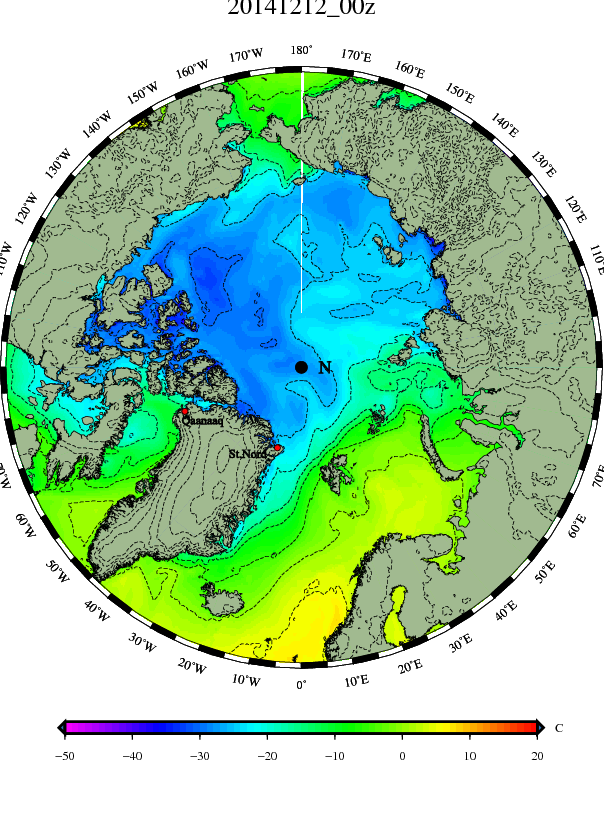
On Saturday Faboo progressed  4.35 miles southwest to 85.996°N, 16.687°W, which is the furthest south it has reached all summer. This is still further north and west of most North Pole Cameras. If a polar storm doesn’t soon blow it southeast it may be sucked into the Beaufort Gyre. Conditions remain cold.DMI MAPS SHOWING MINUS FIVE ISOTHERM

WEAK LOWS CROWD HICHUK OFF POLE

I apologize for brevity. This laptop is too slow.

TUESDAY EVENING UPDATE  —BACK ON LINE—

I basically threw my hands in the air and went fishing. After all, sea-ice is an escape, but so is fishing. I waded and wandered and paddled the Ashuelot River, which meanders from Mount Sunapee to the southwest corner of New Hampshire. I caught four tiny fish which I released, but I really wasn’t fishing for fish. I was fishing for escape, and I found it. I feel sane, which is uncommon.

You’ll be glad to know that even wandering the river banks I didn’t slack off my study of clouds, and the ways things swirl. One fascinating place to fish is in an eddy, where the flow of water goes the “wrong way”,  much as our buoy Faboo has done. Rather than a north Pole Camera I was watching a little red bobber, and even though I was getting no bites I found a fascination in how the bobber moved: The eddy wasn’t a simple circle, but rather circles within circles. The bobber never took the same route twice, much like North Pole Cameras. I was so engrossed in the movement of the waters that I was shocked when I got a nibble (and I did catch a record-setting small-mouthed bass. It set a record for smallness, less than an inch long).

Also the landscape was made by glaciers, so my wandering was full of thoughts about post-ice-age geology. The Ashuelot likely was originally a torrent under the ice, gouging deeply with boulders as big as cars, but then when the mile thick ice melted its canyon became completely choked with sand and it was a flat, braided stream. Then, when the ice was gone and the supply of sand diminished, it began to dig down into that flat and wide stream bed, creating its current meandering channel. For the most part its meanderings now only carve away at its current, lower banks, but here and there the outer curves of the oxbows gnawed at the higher bluffs and exposed sandy cliffs, and I could see the layers laid down by the braided stream stage. It is a distinctive look, neither the flat layers of a lake bottom nor the feathers of windblown sand, but something between the two. It was the pages of a book, read from the bottom up, and towards the top there seemed to be evidence of trees coming north. Some layers had a more rusty look, as if beavers came north with the trees and blocked the channel and the standing water allowed bog iron deposits to build. There also was a thin black layer, and I had to clamber up to squint at it. I could be wrong, but I think there could have been a huge forest fire, and the the river held a lot of charcoal. Then the rivers began to eat down through the braided riverbed, and at the sides the old bottom of the braided stream became a flood plain,  and topsoil began to build up over subsoil. End of story.

I hope you can understand that, after such splendid escapism, to wrestle with a recalcitrant laptop in the dim light by a campground restroom wasn’t an escape. When the laptop got slower and slower, until it took a minute to show the word “the” after I typed it, I decided to escape that escapism. Forgive me. I know it was irresponsible, but isn’t that what escapism is all about?Ashuelot CoveredBridge_Web2008W_80

Photo credit: http://passportamericaclub.blogspot.com/2014/04/ashuelot-river-campground-swanzey-nh.html

FABOO TASTES WINTER  

Faboo continued southwest 5.72 miles on Sunday, arriving at 85.933°N, 17.455°W. Temperatures remained cold, with a high of -2.6°C at midnight and the coldest we had seen to date, (since June), of -7.3°C at 1500Z. On Monday the westward motion stopped at 0900Z at 17.663°W and motion wobbled back east, as Faboo continued south, slowing to 4.03 miles south-southwest and arriving at 85.876°N, 17.639°W. Temperatures recovered to the period’s high of -3.6°C at midnight, and stayed in that general vicinity until the very end of the period, when the official record shows an abrupt drop to -10.7°C.

I can’t help but wonder if that is a glitch. That is impressive cold for the last day of August. Someone with more time than I have might look through old records, to see if this is the earliest any North Pole Camera has seen -10.0°C surpassed.  It raises my eyebrows, and fuels a suspicion I have that we are not properly accounting for some way the arctic atmosphere loses heat.

The unofficial Mass Balance reports show we recovered to  -4.81° C, which we would have called very cold a week ago. However, as the skies clear there can be little short-term hope of warming, with the sun sinking so low at midnight.NP3 1 0901 2015cam1_2 NP3 1 0901B 2015cam1_1Notice that Lake Faboo has vanished under fresh snow. September 1 is early for the melt-water pools to vanish. I suppose one could say Faboo is much further north than other North Pole Cameras have been, but there is no avoiding the fact the starting points were the same, and this ice is more solid.

COAST GUARD ICEBREAKER “HEALY” CRUSHING TOWARDS POLE

I thank “Bit Chilly” for alerting me to the fact that, even as we have lost the eyes of O-buoy 12, we have gained the vision of USCGC Healy as it crunches its way north through ice 4 to 5 feet thick towards the Pole. Here’s a good picture from yesterday of re-frozen melt-water pools.Healy 20150831-0901_595

As of 3:00 Shop Time today they had reached Lon: -179.803568 ° Lat: 87.511580 ° and the air temperature was -5.67 ° C.  You can track them yourself at http://icefloe.net/uscgc-healy-track-map

Their webcam gives hourly pictures and can be accessed at http://icefloe.net/Aloftcon_Photos/index.php?album=2015

The most recent picture is from !:00 AM tomorrow, which suggests ship time may be Greenwich Mean Time. Here’s the view up near the Pole:Healy 20150902-0101_595

There has been a lot of discussion about whether these icebreakers hasten the ice melt by breaking up the ice. My own view is that they only do so at the edge of the ice, where the ice is very slushy and can disperse. In springtime harbors and channels icebreakers could speed the time it takes for those waters to be safe for other boats. However where the ice is refreezing and not entirely slushy they has the effect of a flea. Boats following them  need to stay close or they will be frozen in by the ice “healing” the artificial lead they create, and when the ice pinches in from either side the icebreaker itself can be stopped. The track of Healy shows a quirk at  Lon: 174.867200 ° Lat: 83.674818 ° on August 27 where I imagine they avoided some thicker ice.

Of course the enormous Russian Icebreakers such as “Fifty Years Of Victory” can crunch through much thicker ice, and this time of year make money bringing tourists to the Pole. If you want to go sign up at Quark Expeditions, at http://www.quarkexpeditions.com/en/our-ships/50-years-of-victory for a jaunt on this ship:Russian Icewbreakers sam-crimmin-np-2015-v3-10

As huge as the Russian ships are, they are still fleas in the scheme of things. Remember that. even during the coldest part of winter, leads many miles wide can appear in the arctic sea-ice, be covered by a skim of ice a couple of feet thick, and then be slammed shut with all that skim of ice becoming a pressure ridge that sticks upwards over 20 feet, and downwards over 180 feet. No icebreaker comes anywhere close to such power.

O-buoy Updates

I missed these pictures most, as I escaped escapism. For some reason (which I didn’t bother to figure out) the laptop I used couldn’t seem to download anything beyond the GPS of these buoys.

O-buoy 9 is drifting back north in Fram Strait, which is not correct behavior. I’m sorry, but it simply isn’t done, nor should the south winds nudging it north be below freezing. In Fram Strait all heads south. In fact, because the ice has less of a sail, it likely headed south with the current, as this idiotic buoy used its mast, and headed north into open water, aiming for the ice hesitating at the mouth of Fram Strait. All the water you see is being chilled towards the freezing point of salt water, but even if it froze, it would slide south.

Obuoy 9 0901 webcamObuoy 9 0901B webcamObuoy 9 0901 temperature-1week

If this buoy thinks it is headed north it is a Nutkin taunting an owl.

Nutkin 1 48Nutkin 2 beatrix-potter-the-tale-of-squirrel-nutkin-1903-mr-owl-grabs-nutkin

O-buoy 10 and 11, which ordinarily would be experiencing colder temperatures, are at the end of a salty-thaw, which is where temperatures are above the freezing point of salt water, even if not always above freezing. The winds of Ruckus have faded away, and the broken ice drifts in a sea soon to be slushy. O-buoy 10:

Obuoy 10 0901 webcam Obuoy 10 0901B webcam

O-buoy 11:Obuoy 11 0901B webcamO-buoy 12 likely bit the dust. What tends to happen is that smashing bergs sheer off a sensor up on the mast, and the opening allows saltwater in, to corrode and short-circuit the wiring. We can hope O-buoy 12  reestablishes contact, but the hope is slim.

It is interesting to note that O-buoy 6, which abruptly lost contact on October 25, 2012 in Fram Strait, was recovered this June off the Faeroe Islands, between Iceland and Scotland. They hauled it ashore to examine, saw it had sensors sheered off, took it apart, and now know all about corroded stuff. (WARNING: Following image contains graphic degradation of buoy) Obuoy 6 recovered OB-6-from-Faroes-profile This is the tragic fate that awaits all Nutkins who taunt the owl of Fram Strait, or even Bering Strait.  Not only would O-buoy 9 do well to take a hard look at the above gruesome image, but Faboo should stop acting like such a smarty pants as well. O-buoy 6 was also once a survivor of slush season, and frozen so solidly in ice north of Fram Stait you’d think nothing could touch him, but if you watch the movie you’ll see how the owl’s talons snatched him south and his throat got gripped on October 25: http://obuoy.datatransport.org/monitor#buoy6/movie

I should add that these camera-buoys are not cheap, and they try to rescue them with icebreakers if they can. Many have been saved and are being recycled.   Buoys 13, 14 and 15 are ready to deploy, and already are capable of transmitting pictures:Obuoy 13 webcam Obuoy 14 webcam Obuoy 15 webcam

Sadly, deploying the final three buoys will scrape the bottom of the barrel, in terms of funding these views of the arctic for our lying eyes. There will be no O-buoy 16. The politicians in control of purse strings would rather pay six-figure salaries to pseudoscience-fools who spew pure propaganda,  than cut ten of such social leeches from the budget so we can have an O-buoy 16. Rather than pictures of the ice you’ll get to look at their yammering faces. Why? If we must cut our budget, which should suffer arrested development?

Photo Credit: Ben Powless

Photo Credit: Ben Powless

DMI MAPS

To have a clue about what is going on you must pay attention to maps even when fishing. I didn’t, so I won’t pretend I have a clue what is going on.
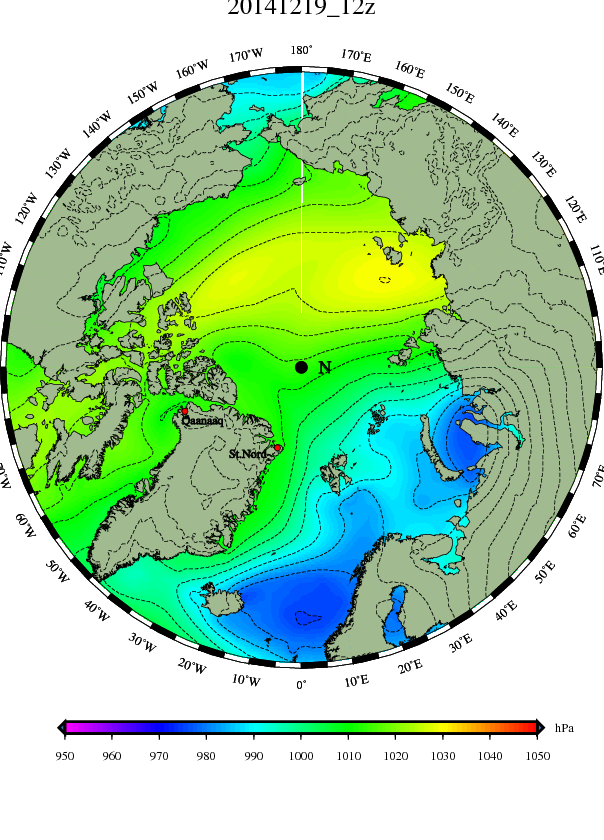
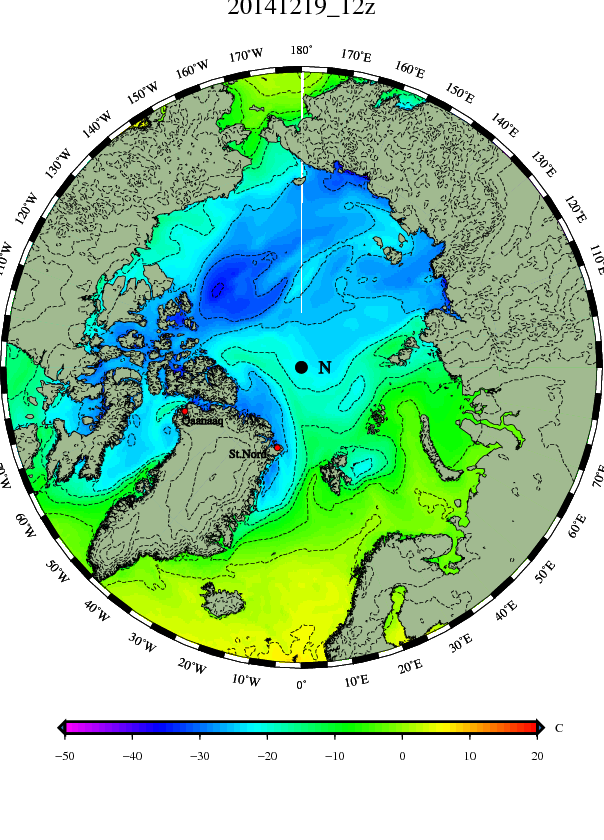
DMI2 0901 mslp_latest.bigDMI2 0901 temp_latest.bigDMI2 0901B mslp_latest.bigDMI2 0901B temp_latest.big

WEDNESDAY DMI MAPS

DMI2 0902 mslp_latest.bigDMI2 0902 temp_latest.bigDMI2 0902B mslp_latest.bigDMI2 0902B temp_latest.big

Ruckus looks like he slid southeast towards Hudson Bay, yet flung a sort of feeder-band of milder and likely moister air north towards the Pole even as he plunged south. The coast guard icebreaker Healy is reporting only a degree below zero as it approaches the Pole, in that band of mildness. Yet my experience is that such feeder bands breed weak low pressure which does not warm the Pole, but rather has the opposite effect.

Dawdleson swirls in Barents Sea, as his father Dawdle seems to have become lodged in the North Sea, and will dawdle there for days. The high pressure over Iceland is unusual, and too far north to be called an Azores High.

Hichuk has deflated to a weak area of high pressure over northern Greenland, and no longer directs traffic. This is giving a resurrected Chuck new life over the Laptev Sea.

All in all things are fairly chaotic, and we need a new high pressure system to step in and direct traffic.The models seem to recognize how indecisive things are and are flip-flopping their forecasts. I’m forecasting nothing, but am watching to see if all the weakrming storms “create cold”, and also to see if the typhoons send a copycat of Ruckus north from the Pacific.

FABOO BETTER BEHAVED

Faboo is making a belated start for Fram strait, and progressed 6.22 miles southeast to 85.808°N, 16.820°W. Temperatures fell to a surprisingly low -11.2°C at midnight, and then rebounded to  the period’s high of -5.1°C six hours later, and slid back to end the period at -6.4°C. The tongue of mildness hadn’t made it to Faboo yet.NP3 1 0902 2015cam1_2

HUDSON BAY’S ICE 

hUDSON bAY sEPT 2 CMMBCTCA

If you click on the above map, and then click it again to enlarge it further, you can see the final bit of ice in Hudson Bay, in September, which is rare. In fact that hue represents one-tenth to three-tenths coverage with ice, and there are plenty of bergs floating in the waters shown as clear. This is demonstrated by polar bears wearing radio collars staying out in waters shown as being ice free. They would swim for shore if there was no ice, as they are not creatures of the open sea. However as long as there are a few bergs to clamber up on, they prefer the sea to the shore. This makes sense. Guys who worked on pipelines up there say the mosquitoes are so bad you don’t need to use toilet paper.  At this time of year the bears fast, for the most part, and you could see why they’d prefer that mosquitoes fast as well. There are no mosquitoes out on the waters, so the bears will stay out there even it is only 1% ice-covered.

WEDNESDAY O-BUOY REPORTS

O-buoy 9 drifted north into a field of bergs freshly coated with snow, experiencing continued temperatures down around -5°C and light winds and an occasional clout to the side of the head by a larger berg.

Obuoy 9 0902B webcam

The Beaufort buoys are still in relatively mild air, and still see ice and not the open waters some maps show.Obuoy 10 0902 webcamObuoy 11 0902 webcam

The slot has grown large, but is still dotted with ice and bounded by thicker ice, so that it will be swift to freeze when temperatures drop.DMI2 0902B arcticicennowcast

THURSDAY MORNING DMI MAPS 

DMI2 0903 mslp_latest.big DMI2 0903 temp_latest.big

POLAR BEARS AREN’T STARVING

Polar Bear healy-aug-24-2015-polar-bear-v-tim-kenna

The armchair speculation of Alarmists was that there was no food away from the continental shelf to feed cod, which feed seals, which feed bears. Apparently this is untrue. Enough green slime grows on the bottom of the ice to feed cod which feed seals which feed bears, so that when the Coast guard sends icebreakers such as the Healy towards the Pole the bear they find far from the shore are, if anything, obese.

Lying eyes beat armchair speculation.

Tracking polar bears – two S. Beaufort bears spent August 2015 on ice that doesn’t exist

THURSDAY AFTERNOON O-BUOY REPORTS

O-buoy 9 is drifting slightly west, but continuing to resist getting sucked south into Fram Strait, midst winds that continue light and temperatures that continue below the freezing point of salt water. It survived a collision with a larger berg, and is currently bumping midst flatter and thinner bergs covered by fresh snow.Obuoy 9 0903 webcamObuoy 9 0903B webcamObuoy 9 0903C webcam

O-buoy 10 continues through light winds and temperatures just either side of the freezing point of salt water. The first picture shows how the darker waters absorb sunlight in September. /sarcObuoy 10 0903 webcamThe second picture is interesting because it shows the sort of slushy water that often is called “Open”. While it is true you wouldn’t attempt to walk on such slush, it is not “Open”, the primary reason being it is far easier to freeze than truly open water is. Open water demonstrates how salt water differs from fresh water, in that colder water always sinks, so that it is hard to get the surface cold enough to freeze. It involves frozen spray or snowflakes of windblown powder, to supply “nuclei” for ice crystals to grow. Slush has those nuclei ready-made.Obuoy 10 0903C webcam

I fear O-buoy 11 took a blow to the chin. It first saw black, and now is seeing white light. I don’t know if you have ever taken a shot to the chin, but the brain tends to produce some odd stuff. O-buoy 11 recently reported a temperature of +300.0°C. Maybe it is just that Global Warming they are talking about, but it aparently made things very steamy, for O-buoy 11 is also reporting humidity of 200%. Now, that is HUMID!  Obuoy 11 0903 webcamObuoy 11 0903B webcam

FABOO THURSDAY EVENING REPORT

Yesterday Faboo continued south and east another 6.34 miles towards Fram Strait, finishing the period at 85.732°N, 16.119°W. It apparently is feeling a bit of the mildness thrown north by Ruckus, as temperatures rose from low at midnight of -4.3°C to -2.2°C at 0900Z, which is the warmest we’ve seen in over a week.  Then there was one of those odd down-spikes during the part of the day when the low sun should be at its highest and nudging temperatures up, and we had to erase the old low for the day and write a new one of -5.8°C, at 1500Z. Then temperatures recovered to -2.5°C, at the end of the period at 2100Z.

These down-spikes make no sense, according to the principles I have gleaned from study, and continue to sting me, constantly rubbing my fur the wrong way by suggesting I am missing something rather fundamental.

Faboo showed more gloom, which we have seen a lot of this summer. The entire albedo-theory is a bit absurd when the sun hardly ever shines. Today’s last picture showed more snow and a frosted lens. Temperatures may have nudged above the freezing point of salt water briefly.

NP3 1 0903 2015cam1_2NP3 1 0903B 2015cam1_1

CONCLUSIONS

As I began this post talking about typhoons, I should mention that there are three in the central Pacific as I conclude this post, even as the two we looked at to start this post fill in further west than is usual during an El Nino. (The GFS model can’t handle the very low pressure at the tightly wound centers of typhoons and hurricanes, so ignore the too-high central pressures in the Dr. Ryan Maue Weatherbell-map below.)Typhoons Seot 3 gfs_mslp_uv10m_npac_1The thing that bothers me about typhoons is the same thing that bothers me about summer thunderstorms. It seems obvious to common sense that they uplift warmth and lose it to outer space, but common sense is, I have been told, wrong. By the time air is uplifted to the top of a powerful typhoon it has been chilled to -70°C, and air that cold has no heat left in it to lose. They can measure it with satellites, and the satellites show cloud tops at -70° are not radiating heat like a cloudless desert baked to +110°.  It makes sense to me. Obviously a cold stove does not radiate heat like a stove that is cherry red.

However my common sense simply doesn’t give a -bleep-. It knows a thunderstorm cools a summer day, and that is that. I don’t care if satellites can’t see any heat escaping. It is gone. (We have been going through a late summer heat wave here in New Hampshire, and a passing storm brought us wonderfully refreshing breezes today, even though the storm didn’t hit us.)

In like manner, my common sense knows typhoons cool the planet. Maybe I can’t explain why, but some things you just know. A small child might not understand electricity, but after sticking a fork into an outlet one time, the child has enough common sense to not repeat the experiment.

This morning I pointed out polar bears don’t care if scientists state there is no food out beyond the continental shelf, they go out there and get fat. In a way bears are smarter than scientists. And in a way I was nearly as smart as a bear, at age ten.

A half century ago my gang was faced with crossing thin ice, and many doubted the ice would support our weight. I was a ten-year-old leader, oldest and wisest. Somewhere I had learned ice can support more weight if you spread your weight out, so I lay down and slithered across the ice spreadeagled on my belly.  Flush with success, I turned, raised an index finger, and grandly pronounced, “This ice is safe!” I also was so filled with confidence that I stood up, and promptly plunged down waist-deep into ice-water, to the joy of the rest of the gang, who didn’t always approve of the egotism involved in my leadership.

Polar Bears may be worse egotists, for all I know, but they do not raise index fingers and make ridiculous pronouncements, most likely because they don’t have index fingers and can’t talk to the verbose degree we can. Scientists, on the other hand, do have index fingers, and make a lot of scientific pronouncements, and can be verbose.

After making careful measurements of the load-bearing ability of ice, and the weight of a polar bear’s massive paws, and consulting engineers who know far more about such stuff than they do, they pronounce ice cannot hold up a bear. (They are much like my gang once was.) The bear doesn’t care. Even though they often swim ice water that would freeze a man in 300 seconds, and have been known to cross hundreds of miles of open water, they apparently don’t always like to get wet, if they don’t have to. So, when they get to thin ice they do exactly what I did at age ten:

A polar bear slides across thin Actic Ocean ice Aug. 21, 2009.

A polar bear slides across thin Actic Ocean ice Aug. 21, 2009.

(Photo Credit: Patrick Kelly)

In short, some scientists need to get out more. They have no actual experience of the outdoors. They spend far to much time glued to computer screens, and despite the exactitude of their measurements, Polar Bears are smarter than they are.

Arctic Sea Ice —The Beaufort Switcheroo—(May 31, 2015)

The blogger “Chris PT” mentioned me in a YouTube video,

In the process he mentioned how watching sea-ice shrink and grow in the Arctic can be a bit like a sporting event, in that Alarmists all cheer wildly when more-than-expected melts, and Skeptics all cheer wildly when less-than-expected melts. I’m not sure I approve, considering billions of dollars are at stake, not to mention the fate of the planet (if you believe Alarmists.)  Also the arguing tends to disintegrate into discussions of the mental state and sanity of opponents, which has little to do with sea-ice, to put it mildly. Therefore I’m going to try to steer clear of such debate, when possible, and if I ridicule anyone it will be myself.

I will expose myself to ridicule by making a guess at what I think will happen. Then I will be wrong. Then I can have all the fun of ridiculing someone, by ridiculing myself.

One forecast sure to be correct this time of year is, “Warmer.”  Temperatures shoot upwards at the Pole, under the 24-hour-a-day sunshine, until they get above freezing and level off in late June. (The average climb in temperature is the green line in the graph below, and you can see how steep the climb is, from April through June.)

What is more difficult to forecast is whether the red line in the graph below will be above or below the green line. For some reason this is the third straight year that temperatures dipped below normal in May. It remains to be seen if they stay below normal for the rest of the summer, as they did the past two summers. I forecast that they will.

Switcher 4 meanT_2015

One way to get an idea how thick the ice is, which gives you a hint about how enduring it might be, is to study the NRL ice-thickness map.

Switch 6 arcticictnowcast If you watch this over a period of time some events become obvious. For example, all winter the ice was pushed from the northwest to the southeast across Hudson Bay, and by April the ice was piled up and thick to the southeast, and newly-formed and thin to the northwest. Therefore it is obvious ice will melt away first in the northwest. I forecast there will be some ice still left in the southeast of Hudson Bay in August.

In the like manner, a lot of ice was pushed out of the Kara Sea, so I expect it will melt more swiftly in the Kare Sea this year.  The Laptev Sea, on the other hand, did not export as much ice as last year. Last year the cross-polar-flow was so extreme that ice was pushed far from shore, leaving so much newly-formed, thin ice that, once melting began, an area of open water I dubbed “The Laptev Notch” formed during the summer, and stabbed north of 80 degrees latitude for a time. I forcast that notch to be far smaller this summer, and to have trouble melting north of 80 degrees.

If you don’t have the time to study the thickness-laps on a regular basis, you can watch a whole year be animated here:

What impresses me most in that animation is the bite the Pacific takes out ice north of the Bering Strait. That ice is solid and thick, at the start, but the influx of milder, Pacific water at the surface melts the ice from underneath, and ice that is ten feet thick in April can be gone by September.

I am expecting quite a bite to be taken from that ice this year, because the PDO (Pacific Decadal Oscillation) is going through a “warm spike”, and the water coming in through the Bering Strait ought be especially warm. However already I’ve blown my forecast in some ways. For one thing, to the south of Bering Strait the water on the Siberian side has become much colder than normal, and that makes me nervous. If it becomes involved, the water coming in through Bering Strait won’t be so mild.

Also the nice, mild breezes that have been rushing up from the south, and affirming my forecast, are putting me through the old switcheroo. They are swinging to the east and becoming colder.

The coldest air is currently parked over the Pole, and along the north coast of Greenland.

Switcher 1 gfs_t2m_arctic_1

However a high pressure is parked north of Bering Strait,

Switcher 5 mslp_latest.big

In three days the cold air will be pulled off the Pole, and it seems the yearly warm-up will be well underway.

Switcher 2 gfs_t2m_arctic_18

The problem with the above map is that it shows the Beaufort Sea during the warmest part of the day. Even under 24-hour-sunshine the sun is higher at noon, and a diurnal variation does occur. Therefore, to play it safe, we look at the situation under the midnight sun,

Switcher 3 gfs_t2m_arctic_20

Now the situation north of Bering Strait and in the Beaufort Sea suddenly looks much colder. This does not bode well, in the short term, for my forecast of melting in that area.

The GFS model makes it look like the high pressure will remain parked roughly where it is, and an easterly flow will move a lot of the cold air north of Greenland to the west, along the Canadian coast and finally to the Alaskan coast. Yesterday I noticed Buoy 2015B: had dropped from above freezing to -3.19° C, and while it has rebounded to -1.33° in the “noontime” heating, the water its camera shows in a nearby lead looks suspiciously like it is skimming over with ice.

Bouy 2015B 0531 camera2

O-buoy #12 (which is due north of Bering Strait and most likely to first feel the effects of the “warm” PDO), has fallen from above freezing to -5°.

Obuoy 12 0531 temperature-1week Obuoy 12 0531 webcam

To the east across the Beaufort Sea, our old friend Obuoy 10 also shows an abrupt temperature drop

Obuoy 10 0531 temperature-1week Obuoy 10 0531 webcam

The buoy I’ll be watching is Buoy Buoy 2015A: , which is right on the coast of Alaska and effected by the sun-baked tundra just to its south. It’s camera is currently showing a lot of melt-water pools and temperatures are at +0.66°. If the camera starts to show the melt-water pools freezing over, then we’ll know the cold air has really backed west.

Buoy 2015A 0531 camera1

Of course, the cold will have to come from somewhere, and if the Pole is robbed of all its sub-freezing air, temperatures will likely rise up that way. They may even get their first thaw of the year. As it is, it is currently -8.42° C up at Buoy 2015D: , which is hard to see but is to the left of this picture, taken by North Pole Camera 1.

NP3 1 0531 2015cam1_1

In conclusion, what is really fun about watching ice melt is seeing surprises occur, and what you don’t expect. I did not expect this cold shot into the Beaufort Sea.

What happened last summer, and I expect to happen again this summer, is for there to be some of these cold spells that come right out of the blue, with their origins more or less a mystery. After all, you reach a point where there is no more cold air left at the Pole. In the current situation the Beaufort cold can be explained-away as a case of Robbing-Peter-to-pay-Paul, but later in the summer Peter is broke, so you can’t rob him. It is when there are suddenly temperatures below freezing in July, without any apparent “source reason,” that your sense of wonder starts to come into play.

I’m looking forward to that.

ARCTIC SEA-ICE RECOVERY –Sneak Attack onto Europe–

The last two weeks has been interesting to watch, though the growth and extent of the ice is fairly normal. Here are the extent maps from December 12 (to the left) and December 27 (to the right).

DMI2 1212 arcticicennowcastDMI2 1227B arcticicennowcast

As Hudson Bay and the Bering Strait have frozen up, most of the growth in ice from now on has little to do with the Arctic. You could almost call it cosmetic. It will be occurring in the Pacific, or the mouth of the Saint Lawrence River, or the Baltic Sea, and therefore will be fleeting, and have little to do with the Arctic Sea itself, which is what all the fuss is about in the summer.

I tend to watch the arctic ice-thickness maps, which can give you an idea where the ice is moving. It moves far more than many imagine. For example, hundreds of square miles of thicker ice that had been lodged north of Franz Josef Land was shifted west by storms and crashed into the north coast of Svalbard, over the past month. This created a sort of polynya of open water where the ice had been by Franz Josef Land, which swiftly froze over and became thin ice.

DMI2 1227B arcticictnowcast

If this large body of ice continued to move west it might be flushed south through Fram Strait, which could create a situation much like occurred in 2007, when the thick ice was flushed south of the Pole, leaving the Pole with a thin skim of ice as summer approached, and, because the thin ice melted easily, the people who assume the icecap is in a “Death Spiral” had something to hype. (The main difference between now and 2007 is that there is much more thick ice north of Canada now.)

Watching the thickness maps allows you to see where the ice is piling up and where it is thinning, and gives you a rough idea on the total volume of ice up there.  There are many interesting processes occurring that you seldom read about.  For example, the same strong winds that blew the ice away from Franz Josef Land also blew the ice away from the south coast of the Kara Sea, and you can see that ice as thin blue lines of thicker ice now out in the middle of the Kara Sea.

Ice really piles up on the west coast of Baffin Bay, and grinds southeast along that coast and then along the coast of Labrador towards the North Atlantic. Ice also can pile up on the south and east coast of Hudson Bay, while the north coast can see polnyas form, so that even though the north was the first to freeze and the south was the last to freeze, by spring the south has thicker ice than the north. Lastly, ice can be seen piling up just west of the Bering Strait on the north coast of Russia; last year this ice was piled up 20 feet thick there by spring.

Watching the thickness maps brings many surprises, especially when storms wrack the ice. In the dead of winter, with temperatures at -40°, I have seen leads of open water form that are scores of miles across and hundreds of miles across. The open water freezes to thin ice almost immediately, but sometimes you can still see signs of that thinner ice months later. In a similar manner storms had a lot to do with the build up of thicker ice north of Canada.

At times the thick ice can crumble and be spread out into open waters, and mess up all sorts of neat calculations in the process. Where a cold current often sinks when it meets a warmer current, and more saline waters want to sink beneath more brackish waters, it is physically impossible for the ice to sink, and it bobs merrily onwards on top, often significantly chilling both the temperatures of the surface waters and the air, until it melts away. Therefore a strong wind transporting ice south can alter temperature maps with startling speed.

I imagine there are times when such alterations make a difference in the forecasts generated by computer models. They may even explain why the models utterly failed to foresee the cold that slumped south onto Europe recently. Just as it only takes a single pebble to start an avalanche, a single miscalculation can mess up a computer model.

Although the models did not see the cold coming, Joseph D’Aleo and Joe Bastardi on their blogs at the Weatherbell site did say we should be on guard for cold waves to hit Europe, as the autumnal patterns were similar to years in the past that saw cold waves hit Europe. They didn’t explain how it was going to happen in a step-by-step way, so I watched very carefully to see if I could see the steps as they occurred.

Back on December 12 we were seeing south winds bring warm air flooding north over Scandinavia, as the Atlantic storms veered north towards the Pole. A lot of Barents Sea was above freezing. Cold air was exiting the Arctic down the east coast of Greenland.

DMI2 1212 mslp_latest.big DMI2 1212 temp_latest.big


This pattern continued on December 14

DMI2 1214 mslp_latest.big DMI2 1214 temp_latest.big


And peaked around December 17

DMI2 1217 mslp_latest.big DMI2 1217 temp_latest.big

By December 19 the storms were no longer heading up to the Pole, but were moving east along the north coast of Russia. Barents Sea was cooling down, and to the east of the storm cold Siberian air was drawn up over the Arctic Sea and then dragged back west, and the milder Atlantic air lost its influence over the Pole.

DMI2 1219 mslp_latest.big DMI2 1219B temp_latest.big


By December 21 the new storm track had the east winds to its north starting to drag cold air back towards Scandinavia. The following Atlantic Gale didn’t bring such a flood of warmth north.

DMI2 1221B mslp_latest.big DMI2 1221B temp_latest.big


By December 24 the new storm track had penetrated weakly to the Pacific side of the Pole, and chilled Pacific air was being drawn over the Pole, but was too cold to warm the Pole much, and the cold air over the Pole was heading south to Scandinavia, and below freezing temperatures seeped down the coast of Norway.

DMI2 1224B mslp_latest.big DMI2 1224B temp_latest.big


By the 26th of December the cold was building over the Pole, and the strongest low pressure was east of Scandinavia, transporting Siberian air back west over its top towards a Barents Sea that was now far colder, especially to its north. The Pole was as cold as it ever gets, except on rare occasions, and the weight of that dense air was spreading out, including down towards Europe.

DMI2 1226B mslp_latest.big DMI2 1226B temp_latest.big


Today we see the following North Atlantic low is weak, without a surge of southerly winds, and the isobars hint of a discharge straight from the Pole to Scandinavia and areas further south.

DMI2 1227 mslp_latest.big DMI2 1227 temp_latest.big

This afternoon’s map shows the weak low bringing snow to Britain and the cold continuing to press south over Europe.

DMI2 1227B mslp_latest.big DMI2 1227B temp_latest.big

The computer models didn’t see this cold coming, even a few days ago, but now much of western Europe is below normal. As this cold continues to press south it is likely create elongated high pressure west to east. There may be a warm-up over Scandinavia as winds turn west to the north of the high pressure, but east winds to the south of the cold high pressure will bring very cold Siberian air further and further towards the Mediterranean, and a southern storm track will bring snows to Italy and perhaps even the north coast of Africa, before the cold is moderated.

DMI2 1227B gfs_t2m_anom_eur_1


However I have no business talking about Africa in a post about the Arctic, so I’ll just show the graph of temperatures north of 80 degrees latitude, which informs us the arctic is loaded with midwinter cold, and has plenty to spare.

DMI2 1227B meanT_2014

Besides dumping cold down on Europe, some is being dumped south into Canada and the western USA.  The thing to remember is that not only the Pole creates cold, but all areas of Tundra and Taiga generate cold as well, during these shortest of days. Better look for where you left your mittens.

DMI2 1227B gfs_t2m_noram_1

(These maps are created by Dr. Ryan Maue at the Weatherbell site.)