
There may still be a down-blip in the extent graph, due to storms tearing at the edges of the arctic ice-pack in places where the bottom melt is occurring, however it isn’t worth the hoop-la it might possibly generate. The melt season is to all extents and purposes over.
The simple fact of the matter is that those who root for evidence that the Poles are melting, and that a “Death Spiral” exists, had everything going for them this past summer. Both the PDO and AMO spiked into “warm” phases, and a big El Nino occurred. Despite this assistance, they couldn’t come close to the low ice extents of 2007 and 2012. To call this summers low extent, (and it was definitely low), a “spiral” is to turn a spiral into a slinky having a bad hair day.
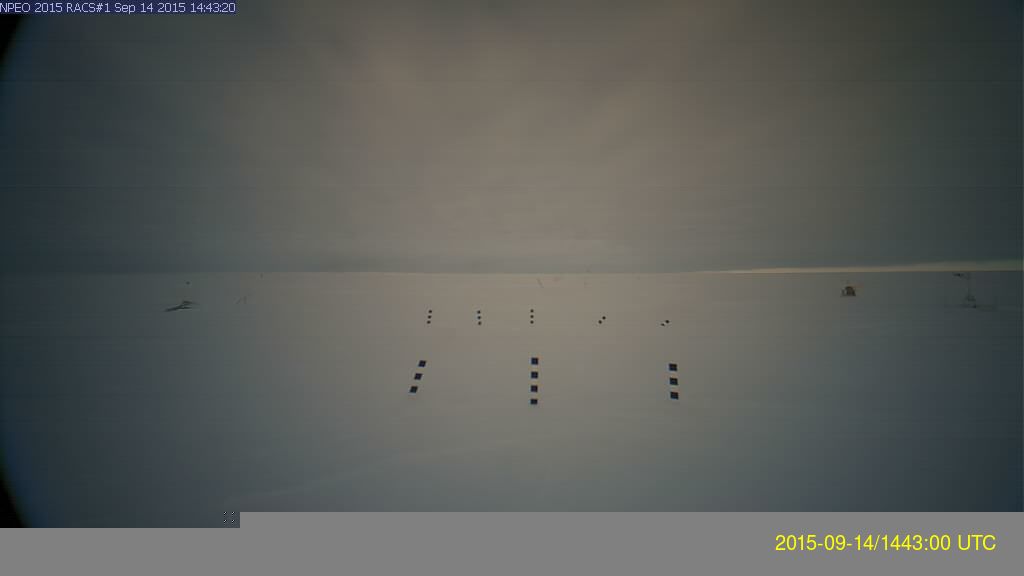
One of the biggest problems with the Death Spiral is clearly shown by this current picture from O-buoy 10, from waters some maps show as “ice free”.
First, the water is obviously not ice-free, which shows some automatic systems have problems seeing wet ice and slushy ice and slushy “pancake ice” floating on the water. However more important is the fact the open water is likely cooling, even with the sun beaming down on it. First, the sun is hitting the water at such an acute angle, this close to the solstice, that it bounces off the glassy surface rather than penetrating, (and a lot does the same even on the more rippled waters). Second, rather than protected by ice, and melting the bottom of the ice, that open water is exposed to air that is currently at -3°, and is losing heat to that air. (In fact that air would likely be colder, if it wasn’t already warmed by the open water.)
In fact, despite the bright sunshine, the water is being cooled, as is shown by the pancake ice floating to the lower left, and also by the oily look the water has out beyond that pancake ice. That glassy look is not due to calm, but to a thin layer of ice crystals expanding out from the edge of the ice.
The theory behind the Death Spiral assumes that less ice means more sunshine will be absorbed by open waters, resulting in warmer waters and less ice. What our lying eyes see is that this is not the case. Open waters result in more ice. It doesn’t matter if this ice is slushy pancake ice, or paper thin oil-slick ice, nor does it matter if such ice is not seen as being ice by satellites, and therefore “doesn’t count” in extent graphs. Ice is ice. What is more, for ice to form the latent heat in water must be released, and therefore, as contrary as it may sound, the formation of ice releases a lot of heat in the arctic, and some this heat is radiated up through the clear, blue skies and lost to outer space.
Not that the skies have been blue all that much. The sunshine that the Death Spiral requires has been rare this summer. Some might suggest this proves Svenmark’s theory, and that the “Quiet Sun” allows more cosmic rays to hit the atmosphere, creating the seeds for cloud crystals. I don’t know about that, but it sure has been cloudy this summer.
That may be a subjective statement, however I can’t afford to place sunlight sensors all over the Pole, and even if I could I couldn’t compare them with past years. I simply note it has been gloomy. When I took a voyage all over the arctic, via the webcam of the Coast Guard icebreaker Healy, I was somewhat astonished by the fact the sun nearly never shone. http://icefloe.net/Aloftcon_Photos/index.php?album=2015
I also noticed the ice was starting to reform on the leads they plowed through.
This is to be expected in September. Bottom-melt can continue in places right into October, but the at the top of the arctic the air temperatures are plunging, and normal is already well below the freezing point of salt water.
Let it suffice to say the Death Spiral has been debunked, for the third straight summer, and therefore I am not going to bother with people who like to quibble about that dead horse. Rather the refreeze is going to be my focus.
I will add one other thing I have noted all summer. The refreeze never really stopped. All summer the thaw was interrupted by cold spells that skimmed the melt-water pools and leads visible to various cameras with ice. Even when that ice melted, I think it must have chilled the summer waters, rather than those waters being warmed in the manner I expected. This likely will have consequences, and I’m keeping my eyes cocked to see if I can spot any differences this year. For example, will the water freeze more swiftly?
SUNDAY NIGHT FABOO UPDATE
(Faboo is my nickname for the North Pole Camera.)
In Saturday Faboo turned more to the east, even shifting 001° to the north at its last entry, moving another 3.21 miles and winding up at 85.190°N, 9.787°W. Temperatures continued to fall, reaching a low of -14.9°C at 0900Z and then recovering to a high of -8.2°C at 0900Z. It then fell to -11.5°C at 1800Z before rebounding to -9.1°C at 2100Z.
This leads one to wonder what happened to the mild air Framja brought north over the Pole. Judging from the pictures, it did what warm air is prone to do. It rises, and is seen as a layer of tattered clouds, but not felt much, on the ground. Also a lot headed south towards Greenland rather than being swept around and back east.

Judging from the time stamp and the shadows, Faboo now looks Northeast rather than north, which indicates the ice it sits upon has undergone some twisting. In the distance a thin white line below the horizon is likely a small pressure ridge, indicating a fracture in the ice, and the potential for a lead opening.
Also it should be noted that Lake Faboo has filled in with drifted snow. If you should ever be aboard a jet forced to make an emergency landing in the arctic while on some Great Circle route, remember that drifted snow can hide thin ice. It is safest to stick to the ice swept clean of snow, as seen in the view from Fabootwo a couple of hours later. 
Fabootwo looks more to the west-northwest north, and some low clouds can be seen off that way. Perhaps this indicates an open lead, but also it may demonstrate the milder air from the weakening Framja is not that far away.
Unofficial reports suggest Faboo continued east today (Sunday), and temperatures took a plunge, which demonstrates once again how the low September sunshine lacks the warming power of July’s.
SUNDAY O-BUOY REPORTS
To the south of Faboo in the mouth of Fram Strait O-buoy 9 continues to report -5° temperatures, light winds, and a slight drift east and a little south. It still isn’t producing pictures.
Across the Pole O-buoy 8-the-second is cooling slightly to around -1°, and seeing winds weaken to the 2-5 mph range, as Framja fades. Despite the mild temperatures the water looks a little slushy, likely due to falling snow being blown from the ice into the water. Notice there is no snow on top of the buoy, which indicates wind, and that the snow isn’t sticky.

Further south towards Beaufort sea O-buoy 10 is experiencing temperatures that have warmed slightly from -5° to -2° in bright sunshine, and winds that have increased slightly to the 4-9 mph range, and shows definite signs that the salt-water is refreezing. Also of interest (and concern) is the large berg approaching in the final picture.


 The large berg is likely what remains of a bigger pressure ridge. Sometimes these jumbles of ice fall apart into many small bergs when the ice breaks up, but in this case the many small pieces were glued together by thaws and refreezes to a degree where they became a single entity. Likely it is “multi-year ice”, and it demonstrates the huge challenge faced by those who attempt to determine the volume of the sea ice. From above it looks like a chip, not any different from a flat piece of first-year “baby ice”, however up close we can see it is far taller, and when we also add the unseen nine tenths of every berg that sticks downwards, we comprehend what a wrench this sort of berg throws into the machinery of volume calculations. (Notice the new ice forming around the edges, which is difficult for satellites to see.)
EUROPE MILD AS ASIA IS COLD
As Framja fades and Framjason lumbers east it is important to remember the arctic was robbed, as a big export of arctic air streamed in the flow behind these lows and ahead of the huge high “Notaz” that gave Europe a summery weekend. It is easy to forget the export of cold air, as it is to a degree “disappeared” in the DMI maps, because the open water loses so much heat that the lower layer of the frigid air is swiftly warmed, and shows up as warmer on the DMI maps than it is, even only 50 feet up. Once the air moves inland it does not take long for the cold to get back to earth.
The following GFS maps of temperature are produced by Dr. Ryan Maue at the Weatherbell site, and are among thousands you can access there for less than a dollar a day. The first shows a mild night over Europe, with even the highlands of Scotland and mountains of Norway having a hard time getting below 40° (4.4° Celsius) and Denmark with wee hour readings up near 60° (15.6° Celsius). The second map shows that in central Siberia a blast of cold air is coloring a large area pink, which is below freezing in the color scale of these maps. (All the pink represents cold squandered, because it could just as well be staying north and freezing the sea. However if it builds a snowpack over Siberia it will indirectly freeze the Arctic Sea, when formerly-warm land breezes start to howl off shore chilled to well below freezing.)
 The final map shows the possible snowfall over Siberia, (inches) due to Framjason.
SUNDAY DMI MAPS
I’ve got a bad cold, and need to sleep, but hopefully I’ll find time to discuss these maps in the morning.


FRIDAY DMI MAPS


It is hard to update with a nose that feels the size of a turnip, sinuses that feel like they extend to my elbows, and a cough that rattles my kneecaps and disgusts everyone within a quarter mile. However I’ll give it a go.
As Framja faded away along the Canadian Archipelago coastline no one wanted to take over at the Pole. It is the height of indecisiveness, with, on one hand, weak low pressure extending from Siberia to Canada, and on the other, weak high pressure extending from the Atlantic to the Pacific, with the high pressure displaced to the Eurasian side.
The temperature maps show the Pole split by milder temperatures, but the cold intence on the Atlantic side and the pool over on the Pacific side growing colder and larger and now containing the minus ten isotherm.
The major decrease in ice melt extent has been on the Eurasian side, caused mostly by ice being compressed and pushed north, especially north of the New Siberian Islands. Off the Alaskan coast there are signs of refreezing, and the flimsy southern boundary of The Slot is persisting, despite many forecasts suggesting it will melt away, and some maps depicting it as already gone. Below are the NRL maps for concentration and thickness, which now show The Slot with no opening to the southeast. The entire yellow area north of the Beaufort sea is likely to turn red this coming week, suggesting 60% Concentration will become 95% concentration.

O-buoy 9’s camera working again.
Temperatures continue cold. down to -7° and back up to -5°, with winds light and a slow drift to the east-southeast. The pictures are splendid, and show the ice-jam north of Fram Strait freezing up. This does not keep the ice from coming south, but may slow the progress for a time.

Slow cooling occurring at O-buoy 8
Temperatures are only just creeping below the freeing point of salt-water, roughly -1.7° where the water is slightly brackish due to melt-water. But we need to remember the thermometer is two meters above the ice, and when it is calm (as it now is) the air right at the surface of the ice can be radiationally cooled, (like the frosty surface of your windshield when there is frost nowhere else), and be significantly colder. As gravity pulls this denser air down over the surface of the water it is swiftly warmed, but the water is robbed of its heat. I think this explains the growth of the pancake ice when temperatures are not all that cold.


O-buoy 10 starting to freeze up
Temperatures are down around -5°, where they’ve been for days, and despite the steady breeze of 4-8 mph the sea-ice is obviously skimming over the waters between the bergs. I’m not sure when such ice becomes thick enough to be noticed by satellites and included in extent graphs. (Sometimes it only needs a dusting of snow to be noticed, even when it paper thin.) If the winds pick up, this sort of ice offers little resistance, and the bigger bergs will plow through it and raise slushly little pressure ridges.


FABOO’S ANTICS
Faboo apparently had second thoughts about heading down to Fram Strait yesterday, for after heading southeast to 85.189°N, 9.732°W at 0300Z it turned around and headed back northwest to 85.204°N, 9.822°W at 2100Z. This represents a backsliding of 0.99 miles for the day, which may not seem like much, but could open a lead more than 0.99 miles wide, when you consider the fact O-buoy 9 was moving south and east at the same time, to the south. (More likely many smaller leads were opened.)
Temperatures remained cold, achieving a high of -8.6°C at midnight and a low of -13.5°C at 0900Z and finishing the 24 hour period at -12.7°C.
Faboo’s antics were likely caused by one of the eddies that form off the coast of Greenland; micro-systems I call “frammerjammers” that mess up all my nice, neat calculations on a regular basis.
The camera’s pictures suggest most of the mild air has been lifted and effects upper regions, but the later pictures hint some of that milder air is working closer to the surface.

 However a final (and gorgeous) picture from Fabootwo shows an image of what is likely snow falling during the midnight sunset, but sublimating before it hits the ground. This would add the aspect of evaporative cooling to our calculations, and hint things might not get milder.
All in all it seems somewhat amazing that the ice supposedly shrank today. I suppose it is because we have no cameras (that I know of) on the Russian side of the Pole, where most of the shrinkage apparently is occurring. 
One reason the ice is able to avoid refreezing on the Russian side is because the cold isn’t hanging around up there to keep waters cold. Instead it has been exported into central Siberia, where I am certain people don’t give a hoot about the arctic being warmer north of them, as they have pretty much had a year without a summer. The map below, (produced by Dr. Ryan Maue at the Weatherbell site), shows the latest blast chilling central Siberia, even as eastern Siberia has the closest thing to a mild spell they’ve had in weeks. Also interesting in the map below is the fact the North Slope of Alaska also is cold inland.

I should mention the above map is a “forecast” map and not reality, and is produced by the Canadian JEM model, which always makes the cold a bit colder (IMHO). In the above map it is noon tomorrow in England, afternoon over eastern Europe, and then the enormity of Siberia has evening and all the hours to midnight, in Bering Strait. Alaska and Canada are experiencing the cold of the wee hours, and day is breaking over Hudson Bay.
The thing about the cold over Siberia is that it will create an early snowpack, which can lead to a colder winter. The meteorologist Joe Bastardi has some interesting arguments that suggest an early snow-pack doesn’t matter as much as the pattern, and has found some historical examples where an early snow-pack in Siberia didn’t result in extreme cold later in the year, but I would humbly suggest that is the exception to the rule. Few people in more temperate climes have the slightest idea of Siberia’s power, and what it can do when its losing heat as only it can lose it.
There are inland cities in Siberia that have, if you look at the weather records, record summertime highs up around 100° (37.8° Celsius) and these same cities have record wintertime lows down around -80° (-62.2° Celsius). Antarctica may get colder, but Antarctic weather is sissy stuff, when it comes to the whiplash Siberia experiences between winter and summer.
One of the most important differences involved in the switch between summer and winter in Siberia is snow-cover. Once the radiational cooling involved with snow-cover starts to occur, Siberia starts to lose heat in a very big way, and “produces” cold. As this cold builds it presses down as high pressure, and that high pressure is no little and meek thing, pushed about by weather patterns from outside. Sometimes it becomes the boss, and rules the weather patterns, and sends hoards of galloping gangsters out like Genghis Khan. Therefore I pay careful attention to the snow-cover in Siberia, in September and October.
NEW O-BUOY 15 INSTALLED
O-buoy 15 was installed a couple days ago on the firm ice north-northeast of Bering Strait, at 81° north and 160° west. (I wonder if the coast guard ice-breaker Healy placed it.) It is liable to mostly show flat and boring ice until next summer, but did record a blast of very cold -15° temperatures, to make things interesting at the start. Temperatures have since moderated to -7° and winds are light, at 8-10 mph. TUESDAY DMI MAPS


That little frammerjammer sneaked north and conquered the Pole, as all the bigger features were distracted elsewhere. The huge Scandanavian high Notaz has been nudged southeast by the gradual eastward movement of Dorga to Britain, but Notaz has a long ridge extending along the Siberian coast, with east winds to its south and a weak Atlantic to Pacific flow to its north. The cold is getting strong north of Canada and Greenland.
FABOO BACK ON COURSE
From the very first official entry yesterday Faboo was back on course southest, as if Sunday’s wandering was just a day of rest. Only in the final entry did it regress .002° north, to 85.187°N, 9.669°W, which was 1.47 miles closer to Fram Strait for the 24 hour period. . The only indication we are dealing with tricky frammerjammer winds is the slow motion.
Temperatures crashed to a day’s low of -17.4°C at 0600Z, recovered to -8.7°C at 1800Z, and then slipped to -9.0°C at 2100Z.
Unofficial reports show the temperatures again crashing today, and the slow southeast drift persisting. The milder air seems to stay aloft, and can’t get to the surface.

O-BUOY REPORTS
O-buoy 8-the-2nd saw temperatures drop to -5°C before the calm broke, and then temperatures rose slightly to -3°C as a slight breeze blew at 4-7 mph. Note the dust of snow atop the buoy. The water between the bergs looks increasingly slushy, and for the moment the bergs are not shifting about much here.


O-buoy 9 continued its slow drift south back towards 79° latitude while shifting east past 7° west longitude. Winds pocked up and temperatures, which had nearly risen to the freezing point of salt water, began falling again. The thin sheet of ice between bergs seems surprisingly stable.


O-buoy 10 has resumed its drift south towards more open waters, and is facing a breeze of 10 to 15 mph. Temperatures are flat at around -3°, so any exposed water is being chilled. The open water we see has been cleared by moving ice, rather than thawing. It seems the buoy currently under the most duress., but at least the big buoy-crusher berg that lay straight ahead yesterday has slipped away.


O-buoy 15 has no new pictures, but temperatures have risen nearly to freezing over that way.
Wednesday Updates
O-BUOY REPORTS
O-buoy 9 spent another day in relatively calm conditions, drifting south and east at the northern entrance of Fram Strait. Winds remained brisk, in the 9-14 mph range, as temperatures sank to around -5° and leveled off there. The thin ice between bergs is under duress and I wouldn’t be surprised to see the water open up a little as the ice disperses southwards. Or perhaps I should say “if”. The frammerjammer low over the pole seems to be trying to reverse the flow yet again.

 O-buoy 8-the-2nd, which is northeast of Price Patrick Island and therefore officially in the Central Arctic Basin and not the Beaufort Sea, (but I’m calling it a Beaufort Buoy and the heck with officials), continues to experience light winds around 2 mph and cold temperatures around -10°, and the open water between bergs increasingly looks frozen over for keeps. Apparently it is close enough to the center of the frammerjammer low to avoid the stronger winds.


O-buoy 10, further to the south and west, is getting hit by the breezes associated with the frammerjammer low, (8-14 mph for several days), and continues slowly south. The thin ice forming over the open waters has been sloshed out of existence in places, and heaped up as slush in others. Where it actually melts it sucks heat out of the water as it goes through the phase change back from ice to water. When the phase change reverses, the heat is released, but largely to the air. The open water has few opportunities for warming once the sun is this low. Temperatures were getting up to the freezing point of salt water, but recently sank back down to roughly -3°.


O-buoy 15, located further east than Point Barrow and is actually our only Chukchi Sea Buoy (though officially in the Central Arctic Basin), has seen temperatures crash back down to -10° after a brave attempt at a final summer thaw.
The breeze has been strong here, generally on the 10-18 mph range, but the ice looks fairly solid. 

The division between the various “seas” and the Central Arctic Basin is relatively meaningless, for if you spray-painted the line onto the ice the ice would move it out of place immediately, and in some cases the line would wind up on the far side of the Pole in a quite different sea in a matter of months. (We followed O-buoy 9 right across the Pole to the coast of Greenland.) The ocean has little regard for man-made lines, or borders. However it means a lot to some, if they can say, “The Central Arctic Basin is melting”, and therefore it pays to be alert to when a Beaufort buoy drifts north across an imaginary line. Otherwise you might lose points in an argument due to a technicality.
Not that there is agreement over where these northern boundaries lie. I have seen maps which draw the northern boundary of the Beaufort Sea as a graceful arc from Point Barrow to Cape Manning on Prince Patrick Island. Others show more of a box, and still others have a direct diagonal line. (I sort of like the diagonal line, for that would mean you could stand looking north on the shore at Barrow, and a rock tossed left would land in the Chukchi Sea, and right would land in Beaufort Sea, but straight ahead would land in the Central Arctic Basin.)
For nitpickers the northern boundary of the Beaufort Sea would lie at the latitude of Cape Manning, or 75.86° north, but I tend to ignore that. It is too far south. All of Fram Strait is north of that latitude, as is most of Barents Sea. However I figured I should warn you, just in case you run up against a nitpicker.
FABOO REPORT
Faboo didn’t officially report, which makes things easier for me, though it does look like it may be turning north again, judging from unofficial reports. The frammerjammer that drifted to the Pole has grown stronger and sunk towards the Canadian Archipelago, which is putting Faboo in its south winds. Temperatures are a little milder but still quite cold, at -8.77° C. All the mild air is aloft, and can never quite make it to the ground, though obviously it supplied enough heat to fuel the frammerjammer. The sun is getting low, and the arctic night (and the end to watching the view from the camera) is not far off.


WEDNESDAY DMI MAPS


I guess we should giver the Frammerjammer a name, “Frajam”. It seems to be absorbing additional energy from a Hudson Bay low that faded north through the Canadian Archipelago. I wish I could take the time to study its development more deeply, for it has been fascinating to see it and its predecessor Framja form out of next to nothing.
Also of interest is the growing area of green-blue inside the minus ten isotherm over the Pole. If the pattern holds, it will eventually become an outbreak over central Siberia, (or so I risk my guess). I sure hope the cold doesn’t come my way.
VOLUME IS GREATER THAN LAST YEAR EVEN IF EXTENT IS LESS

AN EXAMPLE OF SIBERIAN EXTREMES: Flow of the Lena River
When Siberia is locked into cold weather, the Lena River has not a trickle of water entering it from above, and in places can even freeze to the bottom and stop flowing, with the local fish hiding out in the deeper pools until the ground water leaching in (as the only source of liquid water) can lift the ice a little and allow a little seepage to head north. The flow is next to nothing in winter months. Roughly 15% of the yearly flow heads to the delta between late November and early May. But then the seasons change and the river goes nuts. All the snows of central Siberia clear down to Lake Baikal melt and surge north, and the river rises as much as sixty feet in June and has an incredible flow rivaling all the world’s great rivers except the Amazon. It is hard to get your mind around how hugely the flow varies, between a minimum of 366 cu m per sec to a maximum of 200,000 cu m per sec and back again.
This flow freshens the coastal Laptev Sea so much that, if you watch it, you’ll notice it freezes faster than the edge of the sea-ice further out in the Arctic Sea. (The only other northern place where the sea is so greatly freshened is the northern part of the Baltic Sea, the “Gulf of Bothnia” between Finland and Sweden, and there too you’ll notice the sea freeze when “it is too warm.” ) Other arctic deltas show the same freshening to a lesser extent, but the thing to remember is that already the flow of these rivers is starting to dwindle, and by Novermber they will be back to a trickle.
Just imagine how hard it is to figure out the salinity of waters at various levels in various parts of the Arctic with such huge river-variations possible, and also with the start-up and close-down dates of such gigantic floods susceptible to the variables we simply call “an early spring ” or “an early winter.” In terms of computer models, we are not talking about a butterfly flapping its wings, but a difference between 366 and 200,000.
Maybe there are times we should just be a little humble, and confess Creation is magnificent, yet to our puny mind’s calculations it seems like a completely unfathomable chaos.
THURSDAY UPDATES.
Sorry to be so late and so brief but I’m still not over my cold.
O-buoy 8 –Continued cold and calm–Snow on buoy–

 O-BUOY 9 –Colder and Calmer, heading Southeast slower. Midnight Sun Gone.


O-BUOY 10 –Colder, less windy, and refreeze resuming–


Note the ice was shed from the strap in the upper right, though temperatures never quite got above freezing over night. Also notice the slush piled up at the edges of the bergs.
AGAIN NO OFFICIAL FABOO REPORT. HOARFROST ON RECEIVERS?


Unofficial Mass Balance reports suggest moderating temperatures up to -5.06° C and motion resuming to the southeast after dithering about a bit.
DMI MAPS


God willing, I’ll comment on the maps tomorrow.
FRIDAY MORNING


Rhe most interesting feauture to Europeans is likely “Dorga”, bogged down over Norway, but a shield of high pressure keeps it from effecting the Dea ice, so far. Instead my eyes focus on “Frajam”, for even as it weakens north of Canada a long fetch on its asia-facing side is driving the minus-five isotherm towards Beaufort Sea, and the infamous “Slot.”
The slot doesn’t even appear on the Cryosphere map many use, because, although they have 20% ice extent in their map-key to the upper left as a blue color, they have lost the bottle of blue ink and never use it on their maps.
However the Navy Research Lab map does a better job of showing the 20% ice, and makes the Slot quite clear.

So now cold air is pushing ice south and chilling those waters. What will happen to the slot as it spreads wide? (I recognize the potential for rude jokes, but I would appreciate everyone avoiding touching the subject with a ten foot pole.)
O-BUOY 10 REPORTS FROM THE SLOT
The day began dark, as the buoy now has genuine nights, so we couldn’t see what was going on. However we could see we were being pushed south into more open waters
 And we could see that the north wind doing the pushing was crashing the temperatures.
But when I finally got a chance away from work to peek at what daylight showed, I got a surprise, as the warer was more open, yet the open water wasn’t really open.
This large stretch of open water appears to be filled with slush, which is the initial stage of pancake ice. The power of the cold wind is obviously trumping the weak sun, and any residual Pacific warmth from waters down below is being overpowered. Also interesting is the simple fact that the slush is too wet to be registered as sea-ice by many systems, and what you are looking at would be called “open water”.
Of course, if you were the captain of a whaling ship long ago you’d see the entrapping slush growing, and be cursing the greed that kept you hunting a week longer than the other ships, and be using every sail you had to push your way south through the slush, and use every bit of the diminishing north wind to get south as fast as you could.
The only way to get truly open water is in the wake of a larger berg, which sticks it top up like a sail, and pushes through the slush leaving open water in its wake. Soon this slush will become a crust, and the only open water will be when winds blow strongly and wide leads open up.
FABOO FINALLY REPORTS IN
Faboo has been experiencing hoarfrost as some milder and moister air snuck in, I think through Nares Strait on the east coast of Greenland, in association with a Hudson Bay low that headed straight up into the Canadian Archipelago. This has happened several times the past summer. Rather than warm air invading up through the Atlantic, it takes a difficult route through some of the coldest northern landscapes there are, and brings surprising warmth to the ice north of Greenland and Northernmost Canada. This time you could only see a tendril of mildness creeping right along the coast of of north Greenland, but it looks like the moisture extended further north, and got down to ground level, which the last Atlantic invasion seemed to fail to do.
Tuesday’s report showed a slight movement of 1.2 miles to 85.181°N, 9.475°. Winds were light and temperatures crashed to a low of -16.2°C at 0600Z and stayed low until the end of the period, when they bounced up to the day’s high of -7.6°C at the very end.
Wednesday’s report showed another period of indecisiveness, with Faboo moving north and slightly west to 85.219°N, 9.496°W, which was 2,62 miles the “wrong way”. Temperatures hit a high of -6.4°C at midnight and then swiftly sunk to the low of -10.6°C at 0600Z, and then slowly rose to a secondary high of -6.6°C at 1800Z before sinking to -9.0°C.
Thursday saw us heading southeast right from the start, which shows how useless it is to make a “trend line” from a prior report. Winds had picked up to 10-15 mph, but backed off again to a near calm, and we traveled 5.72 miles the “right way” and wound up at 85.149°N, 8.962°W. Temperatures rose to a balmy -3.6°C at 0300Z, but fell back to -12.9°C at the end.
In essence we spent three days progressing four miles. Somewhere a turtle is amazed.
The camera did show we finally got some sunshine:

CONCLUSION
The conclusion is simple: The refreeze is underway. A few blips in graphs can’t really change the reality of growing cold and growing darkness.
Here’s a nice picture from O-buoy 10 showing a berg passing, leaving a trail of open water in its wake.
In the summer such a cold-wave-caused, slushy sea wouldn’t have a prayer of remaining un-melted, for the sun is higher and beaming and never sets, however times have changed on the Beaufort Sea, and 5 hours after the above picture was clicked a new picture showed us this:

Alas, the sun doesn’t stay up forever, and this week will see the arctic night begin at the north Pole, and arctic nights longer than arctic days even down here at 75.5° north latitude. The Big Chill is arriving.
Here is a map of the water temperatures at the Pole. Of course the water under ice will be right at the freezing point (white), but what is interesting is how much of the “ice free” water in the Beaufort Sea is white. (Hat tip: “sandyS”)

If you wonder how open water can be white on the above map, it is because it is at the freezing point but unfrozen. How can this happen? Well, the water in your glass of ice water is the same temperature as the ice in the glass, and the only difference between the liquid and the solid is latent heat in the water that isn’t in the ice.
This brings me to a deep, philosophical question about slush. Is is water? Or is it ice? This profound question is perplexing supercomputers and deranging satellites and disturbing ice-extent charts and causing roaring contentions between Alarmists and Skeptics. And what is the answer?
The answer is this: “Wait a week, and it won’t matter.”


i love your real world summaries caleb. no fancy meaningless math, no extrapolation or supposition. just straight talk based on what you can physically see.
Arctic death spiral:

😉
Ha, I like that! Looks like every slinky I ever had (eventually). And Caleb, “Slinky with a bad hair day” will go on my list of M^3 (Most Memorable Metaphors). Keep up the great work,
Taylor
Perfect image! I’ll steal it for certain to use in my next post, which will be called “The Schizophrenic Pole”.
Re: “O-buoy 15 was installed a couple days ago … I wonder if the coast guard ice-breaker Healy placed it”.
I bet Santa installs these buoys in the off season to keep himself in beer money 😉
My understanding is that it takes more than beer money to install those buoys, and they are running out of funds. I hope Santa is kind to those guys, next Christmas.
still only the one uptick on dmi temperature chart caleb. similar thing happened at the start of the 2012 refreeze season although the temps were much higher. the longer an area of water stays open from now on in, the colder the water is gonna get.
The Pole has a sort of split personality, for the ice at the center has increased volume, even as the the edges are melted away. So the water at the edges will get colder, before freezing over, as the ice at the center gets thicker.
The only thing that could make the water colder would be for a gale to split up the ice at the center, right at the start of winter.
sorry for my poor explanation caleb. my understanding is the sharp temporary spikes in the temperature chart throughout winter are large amounts of heat given off throughout the arctic as the water around the pole freezes over and ice extent increases ?
My guess is some of it is due to a non-zonal flow, allowing surges of mild air north as arctic outbreaks charge all the way south to Mexico and the Sahara. This loopy jet stream is called a “meridianal” flow. Besides bringing warm air north to be swiftly cooled, it makes it more windy at the Pole, and can lead to some cool crack-ups of the ice, which I imagine can also spike the temperatures a bit. All in all I’d say more heat is lost in a meridianal flow than in a zonal flow.
You make following sea ice fun and interesting. Until following your blog, to me, it had all the excitement of watching grass grow. But since climate change alarmists are making a fetish out of it and cooking the books as they do elsewhere, it is nice to rely on you as the voice of truth and reason.
Thanks, though I confess I am more reasonable on some days than on others.