
THE BIG CHILL—SEA-ICE VERSION
(This is a continuation of observations, which the interested can backtrack through, starting with the most recent at https://sunriseswansong.wordpress.com/2013/08/06/north-pole-camera-one-pictures-polar-bear-tracks/ )
At this point it is interesting to compare our current state at the “North Pole Camera” with the situation a year ago.
Last year we had two cameras, which had the following views:
(Click all images, maps and graphs in this post, and its updates, to enlarge them.)


This year we only have one camera, as our second camera had an unfortunate date with a polar bear, and it’s view is quite different:

You can see how much colder it is, if you have ever lived in the north and seen the difference between a thaw and a freeze. Last year was far more slushy. Last year there were melt-water pools. This year it isn’t thawing when it is suppose to thaw. In fact yesterday at our camera it got down to minus 8.6 degrees Celsius. (16.5 Fahrenheit.)
In and of itself, a local cold snap, with temperatures 15 degrees below normal, is just one of those things that happen all over the world. Most of us have experienced record lows in our own towns, and also experienced record highs. In most places records have only been kept a hundred years, and therefore there’s a one-in-a-hundred chance you will see a record high, and a one-in-a-hundred chance you’ll see a record low, and a two-in-a-hundred chance you’ll see a record, each day you wake and sip your coffee. (Records sell newspapers, but in the ebb and flow of life don’t usually mean all that much.)
The only reason temperatures at this camera are a big deal is because some said the North Pole was melting, and that meant we should change our behavior. Because it seems to be failing to melt, it may be that we don’t have to change our behavior (unless we want to.)
And that is enough to begin with. You’ll learn more as I update this post.
AUGUST 16 MORNING UPDATE — FREEZING FOG FORMS
Usually the winds shifts to the southeast and temperatures rise, when fog blows in, but the DMI map still shows sub-freezing temperatures. We’ll have to wait for the temperatures from the Camera Two thermometer, but it looks like this may be ice fog, associated with low pressure forming to the west.
Across the pole there are more sub-freezing temperatures than yesterday.
First picture shows fog forming just after midnight in the midnight sun, (and a faint fog-bow,) and the second shows the fog clamping down just before 7:00 AM.


DMI maps show cross-polar-flow moving air from Siberia towards the Northwest Passage, where it had been nice and warm for voyagers but now is likely getting colder. Also it shows the air in that flow contains an increasing area of sub-freezing temperatures, which I can’t explain. I assumed the air coming off Siberia would hold summer warmth and warm the sea-ice on the far side of the pole, but so far I am wrong.


Lastly, the DMI graph of temperatures north of 80 degrees latitude shows yet another downward tick, which will raise eyebrows in groups that are watching the Big Chill influence the ice-melt. This has been the coldest polar summer since this DMI graph was started in 1958. Since the end of July the melting that is occurring to the sea-ice is largely from waters beneath the ice, and not the air.

AUGUST 16 EVENING UPDATE — BIG CHILL CONTINUES
Temperatures “rose” to minus 4.5 Celsius yesterday, but then sank down to minus 8.0 today. (23.9 down to 17.6 Fahrenheit.) Since then it has risen and then held steady a few tenths below minus 6.0. (21 Fahrenheit)
North winds continue, yet the buoy continues to buck the wind, moving roughly two tenths of a mile north from where it stood yesterday. (From latitude 83.807°N to 83.827°N) After another brief move to the west it again has resumed its drift to the east, to longitude 2.183°E. It’s heading the wrong way, if it intended to get flushed out through Fram Strait.
The ice fog has lifted, but left hoarfrost around the camera lens. The lead in the left distance looks a different color. It may merely be due to the veiled sunlight, but I’m wondering if it might possibly have a skim of ice over it. Brrr. It sure looks cold up there.

LATE NIGHT UPDATE — BIG CHILL EXPANDING
It’s a Friday night, and I really ought be out whooping it up, however for some reason I’m hooked on watching the arctic this summer, and just had to peek at my computer. Right away I noticed the DMI graph of mean temperatures north of 80 degrees latitude ticked down yet again. (Click to enlarge.)

I don’t even see how such a downturn in temperatures is possible.
The first part of the slump was caused, I thought, by that big gale over the pole last week. That storm was suppose to smash up the ice and expose open water, and both the melting of the ice and evaporation of the water would turn available heat into latent heat, through the twin phase-changes of ice-to-water and water-to-vapor. That might cause temperatures to dip.
Furthermore, the uplift of the storm itself would suck a lot of vapor to high parts of the atmosphere, where the phase-changes would be reversed, but because the latent heat was released and made available out nearer our borders with outer space, the heat would escape to warm the arctic stars, as cold snow swept downwards to the ice. So cooling last week was OK. I could accept it as normal. However, this week?
This week the storm is gone, and all that storm-exposed water should be warming the air. There should be some sort of uptick in the graph. At the very least the graph should flatten out, but instead it is plunging steeply.
I clicked onto the DMI map of temperatures for the polar regions, and concluded…. Well, compare these two maps:


Yesterday 00z Today 12z
The below-freezing areas are those in green, inside the boundary made by the dashed black line, and, even without clicking the images to expand them, it is obvious that more than half the Arctic Sea has switched from being above-freezing to being below-freezing, in just 18 hours. The only place freezing temperatures have retreated northwards is from the coast of Franz Josef Land, at 60 degrees east longitude, and that retreat is puny compared to the blitzkrieg advance freezing temperatures have made towards the Bering Strait at 180 degrees longitude.
My immediate explanation is to say it was noon in that direction, during time the first map portrays, and midnight, during the time the second map portrays, so of course it will be colder at 12z towards the Bering Straits. The problem is: We are talking about the land of the midnight sun, and even as far south as 75 degrees north latitude the sun is just now touching the horizon at midnight. The midnight sun hasn’t yet set, north of 80 degrees.
Furthermore, other maps show that area is the area with the most open water peeking between slabs of floating sea ice. It should have the most power to moderate surface temperatures to above freezing. The fact the seas along 180 degrees longitude are failing to do so, even in the summer month of August, demands an explanation. And here is where I must be humble, because I can’t explain it.
Nor can the people who assured us that Global Warming would be “amplified” at the poles, and that the Arctic Ocean could be ice free as early as 2012. (Using words like “could” or “might” or “as early as” doesn’t get a forecaster off the hook when, rather than “amplified warming,” we are seeing record-setting cold.) However I see no signs of them becoming humble.
Perhaps this is why people are so interested in the obscure topic of ice-melt: Because it has the power to reduce the theory of Global Warming to absurdity. It has political implications. No politician likes being reduced to absurdity.
Me? I abhor much that politics seems to embrace. All I want to do is watch the ice melt. The more it melts the happier I am, because I embrace summer. I’d be perfectly happy to see Greenland so warm the Scandinavians could return, and grow barley and brew beer as the Vikings once did, a millennium ago.
Apparently it is politically incorrect to want Greenland to be warm again. I’m suppose to be alarmed if ice melts. But, if that is so, why are some politicians seemingly alarmed that the ice isn’t melting? Why are they worried that rather than “amplified heat” the arctic is seeing record-setting cold? Why aren’t they joyful Global Warming has been exposed by Mother Nature to be a falsified concept?
First politicians are alarmed ice is melting, and now they are alarmed it isn’t. You just can’t please some folk. That is why I avoid politics. I just hope they don’t tread on me, and leave me alone to watch the ice melt. Good night.
AUGUST 17 MORNING UPDATE — CHANGES?
It seems there has to be an uptick in the unprecedented plunge in temperatures sooner or later, so that is what I’m scanning the horizon for. In this morning’s view from camera 2 the clouds look less icy, and above the pressure ridge in the right distance there appears to be a fog bank. However without data I’m just guessing.

The DMI pressure map shows the cross-polar flow breaking down, and a possible inflow of milder air brought north via the east-side, south-wind of a decent gale south of Iceland, with south winds encouraged up towards Scandinavia and then north towards the pole via Svalbard. However a crimp in the isobars seems to indicate a front may be blocking any free flow of warmer air, and the isotherms on the DMI temperature map show no warmth reaching our camera. In fact, for the first time the minus five isotherm has appeared, showing our camera in a pool of colder cold.


At least the map shows a little less sub-freezing temperatures across the pole towards the Bering Strait, although I suppose that may only be a reflection of the fact the 0z map shows noontime, on that side of the pole.
I crave more information, and a search finds this map, which seems to show no major south winds up towards the pole, but rather east winds and west winds around the pole.

That map is from a nice set of polar view maps at http://www.weather-forecast.com/maps/Arctic?over=pressure_arrows&symbols=none&type=wind
However I don’t want to fritter away my Saturday getting a bad case of square eyes gazing at the computer. The Arctic will manage fine without me, I suspect.
AUGUST 17 AFTERNOON UPDATE — UP TOWARDS FREEZING AND UP TOWARD POLE
After reaching the coldest temperatures of this August, -8.9 at 0000z, temperatures at our buoy have risen to -1.1 at 1500z. (16 to 30 degrees Fahrenheit.) If temperatures do get above freezing it will be the first time since 1800z on August 9. This same moderation of the bitter cold has been seen at the companion buoy roughly 100 miles northeast, where their temperatures rose from minus 8.5c to minus 1.0c in the same period. These temperatures are more reasonable for late summer.
The backwards ice continues to head away from Fram Strait, moving from 83.827 to 83.908 north latitude, or roughly five miles north. It has continued its drift east to 2.390°E longitude, but there was one odd jog west at 0600z. There doesn’t seem to be any dramatic wind shifts that go along with these shifts in longitudinal motion, so I surmise they may represent the large, flat berg our camera sits upon jostling and colliding with other large bergs in the Arctic Sea. However the companion buoy is also creeping back towards the pole, so the movement of the ice is, at the moment, not dispersing the ice into open waters but rather cramming it all together at the pole.
The picture from our faithful camera does seem to show an invasion of milder air.

The DMI Pressure map seems to suggest a flow of milder air up over Svalbard, and the temperature map suggests above-freezing temperatures are making inroads on the Atlantic side of the pole, even as midnight again brings sub-freezing temperatures to the far side of the pole, (which is a larger area of the Arctic Sea.)
It must be strange to live north of the Arctic Circle, and have a time when there are no sunsets give way to times when the midnight sun dips just below the horizon before swiftly re-rising. Looking down from outer space, it must be like a tilted line of shadow is rotating around and around the pole, ever advancing north.


Of especial interest is the DMI graph of ice extent. It shows the extent actually increasing slightly. Likely it is just an upward blip in the downward line of melt, but if it continues then it would be an unexpectedly early end to the summer melt, and make headlines. (Click graph to enlarge.)

SATURDAY EVENING UPDATE—CORE OF COLD MOVES NORTHWEST OF GREENLAND
This NOAA map of the mean temperatures of polar regions for the entire 1 day period of Aug 17 smooths out the ups and downs. It shows the below-freezing temperatures exist in all four quadrants around the pole, but that the most severe cold is off the Northwest Greenland coast, and Canada’s most northern islands. It has been backed off, but will it return? The camera shows fog. Watch the stick in the foreground to see if it is freezing fog or not. A milder fog will be a “snow eater,” and more black will show at the bottom of the stick.


AUGUST 18 UPDATE—SIGNS OF THAW
It looks like the crisp packed powder snow has softened and is sagging by the snow stake. (Remember our camera has drifted 350 miles south of the north pole itself, since April.)


AUGUST 18 AFTERNOON UPDATE—A DAY OF THAW
A steady flow of air up from Scandinavia over Svalbard has pushed above freezing air nearly to the pole, as can be seen in the DMI pressure and temperature maps.


A lovely high pressure area is forecast to move up from the Azores into Europe, so the gale southeast of Iceland will be nudged north and then west, until it is back north of Iceland and back towards Greenland, as it falls apart and fills in. My guess is that will weaken the southwest injection of milder air into the Arctic Sea, and our camera will get winds more from the east and northeast.
The southwest flow seems to be pushing the ice back into the arctic, and if it keeps up our bouy will move back past 84 degrees latitude. Since I last positioned it, it has moved from 83.908°N to 83.972°N, or roughly another four miles further away from Fram Strait. (Maybe this ice has decided it want’s to exit the arctic by a Bering Strait back door.)
Subjectively the view from the camera seems colder. The data shows the temperature rose above freezing between 1500z and 1800z yesterday, peaked at 1.7 celsius (35 degrees Fahrenheit) at 0600z today, and had backed to 0.9 celsius at 1200z.
It is still very cold not far to the east, north of Greenland. The far side of the pole is largely below freezing, with a few patches of thaw well away from the pole at high noon.
My guess would be that even if the extent of the ice is less at the edges, towards the center of the Arctic Sea the ice is getting crunched together and is consolidating.
AUGUST 18 —EVENING UPDATE — SCANDINAVIAN COUNTERATTACK
A quick glance at the 12z DMI maps show that the Scandinavians are not going to put up with any of this nonsense involving an early start to winter. Not only are they booting the North Atlantic low back over the top of Iceland towards Greenland, and trying to talk a warm high pressure all the way up from the Azores to keep their beaches sunny, but they are arranging isobars to whoosh the Big Chill away from their northernmost shores.
So far they have succeeded, and the zero isotherm has been pushed past the pole, but lurking, with obvious sinister intent, just to the northeast of Greenland and north of Canada is a big, mean, dour-faced bully, shown by the face described by the five-below-zero isotherm. Will it counterattack the counterattack? Wait for the next exciting installment of “Watching Ice Melt.” (Click maps and graph to enlarge.)


By the way, the DMI graph is showing the Scandinavian Invasion with an uptick. However notice it still is only halfway back to normal, and normal is now dropping below the freezing point. Across the pole a large area of the Arctic Sea towards the Bearing Strait is below freezing as midnight sun turns to midnight twilight. (12z is midnight on the far side of the pole.)

AUGUST 19 MORNING UPDATE —SURPRISING EROSION OF THAW
One reason I find watching ice melt intriguing is because I am constantly having my preconceptions shattered, and being surprised. This morning is no different.
The view from our camera is a bit slushy for the first time in a long time. I am wondering if what I assumed was a “lead” in the left background is actually a melt-water pool. I still assume it is a lead, as a melt-water pool would have refrozen and become snow-covered during the prolonged freeze of last week, however I am questioning my preconceptions.
(I am also questioning whether the wind-indicator at our buoy might be giving readings that are roughly 100 to 180 degrees off. All summer the buoy has seemed to move into the wind rather than with the wind, and now that I am looking at more maps the indicated wind never seems to match the isobars.)

The big surprise this morning is not so much the charge of milder air right across the pole, but instead colder air which is swirling in behind that charge. I didn’t notice this sneaky swirl last night, but 20-20 hindsight now sees it. This morning’s 12z map makes the chill most obvious in a feature between Novaya Zemlya and Franz Josef Land: A pocket of sub-freezing air exists where the sea is ice-free and the water temperature is between 4 and 8 Celsius. (Less surprising are other pockets of sub-freezing air to the east over Severnaya Zemlya, as that area has retained ice-cover even to the coast.)
Another surprise is a pocket of very cold air shown by the minus-five isotherm on the DMI map. I don’t think this is associated with the very cold air that was northeast of Greenland on the 0z map, as the winds suggest that air was largely swept inland over the islands of northernmost Canada. Rather I assume this new pocket of sub-five-degree air was “home grown” over the thick ice on the far side of the pole, which surprises me because it is high noon at 0z over there, and also the cold seems close to, if not actually over, the edge of the ice and the start of the open water.
Lastly, the high pressure sitting atop Greenland is pouring air off the icecap as an east wind at the north of Greenland, and that must be a cold injection into the warm flow.
In conclusion, the Big Chill is still out there, even as the thaw attacks. It will be interesting to watch what happens as the two swirl together like dancers.


AUGUST 19 AFTERNOON UPDATE —UP PAST 84 DEGREES–WIND SHIFTS—THAW ABRUPTLY ENDS
At 6:00 AM BCT (Bouy Camera Time) The thaw was continuing, with temperatures as high as 1.4 C at 2100z yesterday. The buoy was proceeding merrily the wrong way, north to 84.029°N by 0900z today, when a major change was taking place. Here is the wet 6:00 AM picture:

At 1200z, as our camera was minding its own business and just sitting down to a nice, quiet lunch of electronics and toner, all hell broke lose. The wind shifted right around, temperatures plunged to just below freezing, and the ice came to a screeching halt and started back south. The poor camera broke into a sweat, which you can see dribbling over the lens at noon:

By 1500z temperatures were back down to -1.9C, and the ice down to 84.008 north latitude.
Meanwhile, roughly 100 miles northeast at the companion buoy, at 1500z it was still thawing, but the wind had just started to shift. Also that buoy had only just then stopped its northward drift, and hadn’t started south, which suggests a lead would have had to open in the ice somewhere between that buoy and “our” buoy, for the two buoys were for a time going in roughly opposite directions.
TROUBLE FOR ME—SIX MORE BUOYS TO WATCH
I found a link to a Navy map. http://imb.crrel.usace.army.mil/newdata.htm which has the drift chart that appears below:

However if you click the link, then below the map you see boxes which show what data each buoy has recently collected, and in some cases whether the ice is getting thinner. In most cases it isn’t. (“Our” buoy is “Buoy 2013E” on this page.)
It is a real treasure trove for a person who likes to watch ice melt. How am I to get anything else done? (Hat tip to the blogger “Brian D.”)
ANOTHER COOL LINK
(Hat tip to the blogger “SAMURAI.”) Here is a link to a DMI site that allows you to compare the ice cover, and click backward and forward to compare the ice-cover on one day with another day. It will prove a invaluable tool, in terms of seeing where ice-cover is growing and where it is shrinking, over the next three or four weeks.
http://ocean.dmi.dk/arctic/satellite/index.uk.php
THE BIG CHILL IS BACK
Sometimes a 1800z picture can speak a thousand words:

AUGUST 20—MORNING UPDATE—A POLAR WALTZ
Our camera is cold this morning; down to -3.85 according to the army link, (which gives the date but not the time.) An interesting new feature in the the picture is the enlargement of what I assume is a “lead” in the distance. Formerly it was only seen to the left, but now it extends past the middle, and even can be seen peeking through the peaks of pressure ridges to the right. (Click picture to enlarge)

The DMI temperature and pressure maps show the cold that charged past the camera yesterday has reconquered the pole, but just past the pole the above-freezing flow up from Scandinavia continues, and has penetrated to the heart of the Arctic Ocean. Sea ice is shrinking where it first enters the Arctic, north of Franz Josef Land, and a “ice free” hole has appeared in the sea ice in that area. Meanwhile ice on the the Alaskan coast and towards Bering Strait is growing in places. It is especially cold off the coast of Canada.


My sense is that the current surge of warmth has past its peak, and the above-freezing and below-freezing air will now swirl, mingling together like cream into clear tea. (The word “stir” has the same root as the word “storm.”) They will waltz together and merge into something new, as the low pressure north of Iceland fills in. The current pattern, which amounts to a cross-polar-flow from Finland to Alaska, will be snapped in two as everything reorganizes. It will be fun to watch the next pattern evolve.
Beautiful weather is bathing Europe, and one question is whether it will extend north towards the Pole, or chose to pour its benevolence eastwards towards Eastern Europe.
A question more interesting to me concerns what happens to the mingled air now mixing over the pole. I am going to stick my neck out and say it will chill more rapidly than seems possible, for that is what has been happening to air up there all summer. The cause is open to debate, but perhaps the seawater between the icebergs is slightly colder. In any case, for the moment the air temperatures north of 80 degrees latitude are at long last back to normal, and this warm surge may briefly put them above normal (though still below freezing,) but my hunch is that we will then see the Big Chill return.

AUGUST 20 —EVENING UPDATE— PINCERS NARROW SPEAR OF THAW
The cross-polar flow continues, and the pulse of above-freezing temperatures are spearing nearly across the Arctic sea, even as sub-freezing temperatures counter across the Pole at the Greenland side of the thaw. I am reminded of old military maps of “The Battle Of The Bulge,” with the Germans striving ahead as the Allies strive to pinch in from either side at the bottom sides of the bulge. Therefore I find a certain irony in the way the above-freezing temperatures resemble a spear-point.


Actually it is a bit absurd to use the analogy of two armies battling. Yesterday I described the two air masses as “waltzing,” and for all I know the two air-masses may be the best of friends, with their rivalry like a friendly round of golf, and I am like the sportscaster screaming into a microphone at the sidelines, when they’re trying to concentrate and putt.
I’m just trying to liven things up a bit, during a lull. That low north of Iceland isn’t going to turn into a dramatic super-storm, but rather is just going to fade away, and in 48 hours there will be a boring ridge of boring high pressure in its place, extending down to glorious weather in Europe. People will be laying around on towels and soaking up the sun, and where is the drama in that? Therefore I look elsewhere, and notice how the minus-five isotherm over Canada’s northernmost islands is expanding, and looks a little like an elephant. Now, that makes a good, blaring headline: “Elephant Of Cold Grows In Arctic!”
Or I could be more subtle, and point out that even with the spear of warmth right through the heart of the Arctic Ocean, temperatures are again sinking below what we’d normally expect on August 20. (A bit of ominous background music would be helpful, as well.) (Click to enlarge and make the tiny down-tick visible.)

Of course, while such antics may be entertaining, they are basically balderdash. The truth is that a lull is a lull is a lull. We are in wait-and-see mode.
During such an interlude it does no good to restlessly pace to and fro waiting for something to happen. You might as well restore yourself with some rest and relaxation. In fact that was my original reason for watching ice melt. It is a tranquil thing to do. Therefore, as it is hot and humid here in New Hampshire, I think I’ll just gaze at the pictures of cold fog and ice for a while:


Those are the 1200z and 1800z pictures. While enjoying how cool they made me feel, and the peace and serenity of having not much change, I abruptly did notice a change. (Before I tell you what it is, click and enlarge the pictures and see if you can spot the change for yourself.)
I assume the low clouds we see are due to the cold air north of Greenland meeting up with the flow of warm air coming up from Scandinavia. The data shows temperatures sunk to below the freezing point of salt water for 20 hours, bottoming out at minus 3.2 Celsius at 2100z yesterday and still at minus 3.2 Celsius at 0600z today, before they began rising. (The army data reported -3.85 Celsius at one point, but that may have been between the every-three-hour increments of the North Pole Environmental Observatory data.) By 1500z today the temperature had nearly risen above freezing, to minus 0.3.
This was likely due to a wind shift which also effected the east-west movement of the ice. As soon as the wind shifted the ice reversed direction, no longer moving east and instead moving west. Back on the 17th at 1500Z the buoy reached 2.390°E longitude, but since then it has been banged, bumped, and wind driven back and forth, and recently has moved from 2.321°E at 1500z yesterday to 1.748°E at 1500z today. Meanwhile the southward movement that started yesterday has continued, the buoy crossed 44 degrees north latitude yet again, and it moved from 84.008°N at 1500z yesterday to 83.930°N at 1500z today.
The odd thing is that the movement of our companion buoy, roughly 100 miles to the northeast, is not at all the same. As our buoy has moved steadily south, it moved south, then north, then again south, and at last report was headed north again. Furthermore, as our bouy moved steady west, it started by moving east, and only later decided to go west.
The fact these big, flat bergs of ice are independent spirits who go their seperate ways makes mincemeat out of extent and area maps, and volume calculations. It makes me think. (A sort of rough draft of my thought, including a few embarrassing errors, can be seen at: https://sunriseswansong.wordpress.com/2013/08/06/a-laymans-observations-concerning-arctic-sea-ice-volume/ )
However now let us return to the two above pictures from our camera. Did you spot the difference I did? It involves the dash of darkness in the background distance just above the central buoy. It is a bit larger in the 1800z picture than it was in the 1200z picture. In fact in the 1200z picture, (if you click it to enlarge it,) you’ll see a dash with a dot to the right, but by 1800 it is a single larger area, like a shallow crescent. What creates the difference?
My theory is that in the first picture the far side of the lead is near, and in the second the far side is much farther away. In other words, the lead is widening. The two chunks of flat ice are independent spirits with minds of their own, and are currently moving in opposite directions.
That lead is closer than it looks. Having open water so close may not only raise our temperature readings, but also may threaten the life of our intrepid North Pole Camera itself. STAY TUNED FOR THE NEXT EXCITING EPIDODE!!!
AUGUST 21 —MORNING UPDATE— SUBTLE CHANGES
This morning’s 00z DMI maps still show the cross-polar-flow quite strong over the Pole itself, but it is no longer fed by isobars showing a flow up through Scandinavia, and in fact the inflow is falling apart. A high pressure ridge is building over Iceland as the old low to its north fills in. The “elephant” of cold shown by sub-minus-five isotherms remains just north of Canada. The above-freezing isotherm has again conquered the pole, just barely.

The map does not show the very cold air pouring off the northeastern part of Greenland’s icecap and heading east. The army data states temperatures at “Buoy 2012M,” located just off that coast at 81.54 N, 120.48 W, are down to minus 7.58 Celsius; (18.38 Fahrenheit.) It is milder to the northeast at “our” buoy, barely below freezing at minus 0.07 Celsius.
I suppose the clash between the two air masses are keeping it grey at our buoy, however it looks a brighter shade of grey this morning, and there is clearing not too far to the west, north of Greenland. I hope it clears up, so I can get a better view of what is going of in the background of our picture.

AUGUST 21 —EVENING UPDATE— THE GROWING ELEPHANT
The DMI 12z maps show that the cross-polar-flow is increasingly ingesting air from colder source regions. While above-freezing air retains its conquest of the Pole, it is beset on both sides by below-freezing air.
Of special interest is the expansion of the area bounded by the minus-five isotherm. The elephant is growing. Just look at the size of its trunk!


Despite the proximity of the cold, our camera has basked in the balmy breezes of temperatures a hair above freezing. (0.4 Celsius; 32.72 Fahrenheit.) A light mist of rain may be falling, shown by drops on the lens of our camera, during the most-recent picture.
Also our camera is rocketing south at roughly six miles a day, (covering nearly a full tenth of a degree in a single day, and a handy approximation is to call a degree of latitude 60 miles. ) It moved from 83.930°N at 1500z yesterday to 83.829°N at 1500z today. At this dizzying pace it soon will be as far south as it was a week ago.
Interestingly it stopped edging west and started edging back east, without a wind change. I assume this means that the berg our faithful camera is on bumped into some other berg, or got bumped. (Traffic gets heavy in the rush hour.)
The 12z and 18z pictures may look like the same, old same-old, but once again subtle changes can be seen if you play, “Can you see the differences between these two pictures?”
(Don’t be fooled into thinking the difference is that a flock of odd, black, crescent -shaped birds are flying about. Those are drops of water.) (One time the dark, curved line of a single drop fooled me by being perfectly positioned on the horizon; I mistook it as smoke from the funnel of a distant icebreaker.)


Ignoring the drops of water, focus on the dark line on the horizon, which I take to be the open water of a lead. To the left in the 12z picture there is a single gap in the dark line, but in the 18z picture the dark line has three breaks. The barely discernible break to the left of the original break is most interesting to me, because I take it to mean the ice across the lead is swiveling closer.
However if you switch to and fro between the two pictures, focusing on the dark line directly above the buoy, it actually seems to increase in the second picture, which tends to suggest either that that part of the lead is widening, as the far side swivels away, or that there is a break in the far side.
I make the second suggestion because if you allow your eyes to traverse to the right to a single dash of darkness peeking between the pressure ridge, it gets smaller in the second picture, which means the far side of the lead would be closer there, which could only happen if it was an independent piece of ice.
(Life sure would be a lot easier if this camera had a zoom lens. Also it should be able to pivot left and right. After all, they have robots driving around Mars, and cameras watching pedestrians amble down English streets, swiveling if need be to follow the progress of a beautiful women. They ought to be able to do better with a camera at the North Pole. In fact I think I’ll buy them a better camera myself, if I win the lottery.)
However we are stuck with what we’ve got. And actually you can deduce a lot, if you play, “Can you see the difference between these two pictures.”
Not all that you deduce is correct. For example, the time I thought I saw the smoke from the funnel of an icebreaker I rushed to be the first to spread the news, and felt foolish when I found out the dark curve on the horizon was a drop of water on the lens. But that is how you learn. You have to be cheerful about making an ass out of yourself, because it is better to stand corrected than to preserve pride before the fall.
AUGUST 22 —MORNING UPDATE— WET LENS
Looks misty up at our camera this morning, which is probably a good thing, as I’m busy today and shouldn’t be ice-gazing.

The DMI pressure and temperature maps show the Atlantic low filled in and replaced by a ridge to high pressure over Europe. The new pattern has continued the cross-polar-flow, but with completely different source regions, as the high over Siberia and the low over Northernmost Canada grow in predominance.


While the above map shows the North Pole still thawing, the most recent “army data” shows “our” buoy has slipped from just above freezing to just below, at minus 0.22 Celsius.
The Big Chill has not reestablished itself, at this point. However any time the temperature dips below freezing the rainwater atop the ice freezes, and turns from a substance that weakens the floe to a substance that hardens it.
AUGUST 22 —AFTERNOON UPDATE— ELEPHANT IS FROWNING
My over-active imagination tends to see faces in clouds, and also in isotherms. The “elephant” I first saw two days ago, made out of the minus-five-degree isotherm north of northernmost Canada, seemed to have fallen apart this morning, but the 12z DMI map has the elephant back, bigger, and frowning. I think the expansion of the colder air is newsworthy. Despite the cross-polar-flow sucking in a lot of moist air from the Atlantic, roughly three quarters of the Arctic is now below freezing. The Big Chill is growing.


Our camera’s view is lousy, due to water on the lens. However the water is apparently starting to freeze on the lens, in the second, 18z view. (Click views to enlarge.)


The temperature has remained just above freezing all day, only sinking to exactly zero in the final 1500z report. Of more interest to me is that our camera stopped heading south, reaching 83.784°N at 0600z, and started north again, reaching latitude 83.795°N at 1500z.
One reason ice extent graphs are not higher is that there is so little ice in Fram Strait. This is not because it is warmer in Fram Strait, but rather because ice, such as the berg our camera is on, refuses to head south.
Gotta go, but I hope to ruminate on this subject more later.
138 VIEWS
I came home after a long day’s work yesterday and sat down to amuse myself watching ice melt, and was somewhat surprised to see that, (using a WordPress feature,) that this little site had seen 138 visitors in the past hour. I wondered, “What the heck ????” That’s more views than I used to get in a week.
I wasn’t expecting so much company. After hurrying into the bathroom to comb my hair and put on a clean shirt, I returned to see if I could figure out what in the world was going on. All the traffic was coming from Anthony Watt’s site, and a bit of back-tracking spotted a nice comment by Eric Simpson at 1:56 PM. http://wattsupwiththat.com/2013/08/22/open-water-at-the-north-pole-2/
In any case, by the end of the day this little site had 536 views, which set a local record. (I guess I’ll have to start wearing a suit as I type.)
LONG RANGE FORECAST—STORM COMING NORTH FROM ICELAND TO CAMERA.
If you click on this site and run the animation feature, you can see a gale that is currently blowing up south if Iceland is forecast to head north right over Iceland and crawl up the east coast of Greenland, arriving at our camera next Tuesday.
http://www.weather-forecast.com/maps/Arctic?symbols=none&type=prec
The storm is expected to weaken before it gets to our camera, but I suppose we could see the ice stressed. Also it will be interesting to see if the camera gets blown north of 84 degrees again.
AUGUST 23 —MORNING UPDATE— THAW ENDING?
I am a little confused by differences in the data between this site: http://psc.apl.washington.edu/northpole/index.html which shares the same pictures as this site http://imb.crrel.usace.army.mil/newdata.htm . I call the first site “our” site and the second site the “army” site. The first site refers to our bouy as IABP PAWS Buoy 819920 while the “army” site refers to it as Buoy 2013E. Perhaps they share the same camera but have different thermometers, but in any case the “army” readings seem roughly three quarters of a degree lower. This morning the “army” reading is minus 2.69; (27.2 Fahrenheit.) “Our” data gets released around lunchtime.
The DMI maps suggest to me the Pole shouldn’t change that much, as the inflow to the cross-polar-flow continues to be maritime air from the North Atlantic. The cold north of Canada is still strong but a little less intense, as noontime swings around past that part of the arctic. (I can still see the “elephant” in those blobs made by the minus-five isotherms, but then my imagination is particularly dreamy in the morning: The blob of sub-zero air towards Europe is a frog, and the elongated area of sub-zero air towards Siberia is an old lady with a big nose and a basket in her lap.) (Looking back, I pity my science teachers in high school, who had to deal with my imagination.)


It is quite normal for temperatures to plunge this time of year, as the DMI graph shows:

As there was a lot of open water after last years polar gale, the DMI graph was slow to fall and remained above normal for quite a while. However I imagined that storm heaped up the ice where ice remained, and significantly chilled the water between the surface and the “pycnocline” where water was exposed, and finally that the record-setting arctic snowcover last spring retarded the warm-up. Therefore I actually was expecting the arctic ice to be tougher this summer, and for us to see “the Big Chill.” However I have been wrong about how early I expected to see the refreeze start. In am on record as saying I expected everyone to be surprised by how early the “extent” graph flattened out, and it hasn’t done so: (Click to enlarge.)

Oh well, I suppose one can’t be right about everything. At least I can admit I’m wrong when I’m wrong, which proves I’m not a true Climate Scientist.
The view from our camera looks much colder. I hope that ice sublimates and falls off the lens, so we can get a better view of what’s happening in the distance. (Click to enlarge.)

AUGUST 23 —AFTERNOON UPDATE— BRIEF COLD SHOT
Temperatures dropped from zero at 1500z yesterday to -2.7 Celsius (27.1 Fahrenheit) at 0600z, before bouncing back up to zero at 1500z. In the same time period our Wrong-way Camera continued to edge away from Fram Strait, moving from 83.795°N to 83.833°N.
Temperatures continue quite cold in the Beaufort Sea north of Alaska and Canada. The two bouys there are reporting minus 5.88 and minus 4.76, while the buoy north of Canada’s northernmost Elizabeth Islands is even colder, reporting minus 7.35. Its been cold for some time over that way, and I’m keeping an eye cocked for an increase in the ice.
Our camera’s lens is finally clear, but now the sun’s in my eyes.

AUGUST 23 —EVENING UPDATE— WILD-EYED ELEPHANT
(As always, click all maps, pictures and graphs to enlarge.)
The DMI 12z maps show the sub-minus-five cold north of Canada is still strong, and now the “elephant” has an “eye.” The above-freezing Atlantic air is pumped by the cross-polar-flow right across the pole, as a gale lurks south of Iceland.


The sub-freezing air curls right around the above-freezing air, which creates a false impression if you think only of the area above 80 degrees north latitude. The DMI graph of that area shows temperatures “above normal” for the first time since last spring, but much of the below-normal cold now lies south of 80 degrees latitude.

The 80 degrees north area is inside the smallest circle of the following “ice concentration” map.

It is interesting how the really cold air is all out at the edge of the ice, where it could possibly hasten the refreeze. I’ll be watching the “ice extent” graphs with keen interest over the weekend.
At our camera the fog is back.

AUGUST 24 —MORNING UPDATE— SUNSHINE AND A CHANGE IN PATTERN
It is a nice sunny morning at our camera, (if any time can be called morning where the sun doesn’t set.) Three hundred fifty miles south of the pole, the sun has dipped past its midnight low and, without setting, now rises towards its noontime high. However the shadows are getting longer, and there is no sign of thawing. The sun simply isn’t getting high enough to heat much, anymore, and clear weather often indicates drier air that makes it colder. The “army” data states it is just below freezing, at minus 0.2.

The DMI 0Z Temperature Map still shows the remnant of the cross-polar-flow’s effect, even as it breaks down. A horseshoe of sub-freezing air surrounds the above-freezing influx from the Atlantic. The Pole has been reconquered by subfreezing air, but it is not very far below freezing. The “army” data at our “companion buoy” is at minus 0.21, while “Buoy 2012J:,” up at 87.1 north latitude, is coming in at minus 1.04. To the south, at the buoy just off the coast of Greenland in Fram Strait, it is very cold as air flows off the icecap, at minus 7.29.
The “elephant” of sub-minus-five degree isotherms towards Canada is smaller, but that is largely due to noontime swinging through that part of the pole, and the fact they now are experiencing actual nights. While the sun still is up for 24 hours a day at eighty degrees north latitude, at seventy-five degrees north the nights are already four hours long, and the two buoys in the Beaufort Sea are both south of 75 degrees. The “army” data reports them at minus 5.18 and minus 4.38 in the “warmth” of the afternoon. Meanwhile, north of Queen Elizabeth Island where the sun still doesn’t set, the buoy is coming in at minus 5.60. The final buoy of the eight “army” buoys, tucked in between northwest Greenland and Queen Elizabeth Island, is at minus 2.61.
Despite the fact not a single “army” buoy reports above freezing temperatures, across the pole the residue of the invasion remains, however the DMI pressure maps shows it is now cut off from reinforcements. A weak low over Svalbard and another down towards Siberia are plugging the channel, and bending Atlantic winds eastwards over Scandinavia. I think this is a hint of things to come.
The big gale over Iceland represents the final chance for Altlantic air to invade. The weakening gale will come north towards our camera, and the rush of south winds up its east side may give our camera another foggy thaw at the start of next week, however as that low weakens it will turn east and become but one of a string of low pressure areas extending from south of Greenland, past Iceland, north of Scandinavia, and along the Siberian coast. Winds to the south of these lows will be generally west, and to the north they will be generally east over the arctic, and the necklace of lows will form a sort of wall keeping the mixing of Arctic and Atlantic air at a minimum.
I imagine that the east winds that will then develop around the Pole will completely reverse the cross-polar flow we now see. Rather than the ice being jammed over towards Canada and packed on that side of the pole, ice will be dispersed out into the seas north of Svalbard. Even though those seas melt ice more effectively, the extent is likely to show an uptick, and those seas are likely to be chilled. If ice also forms on the coast of Alaska, the extent graph could flatten out or even rise. Or so I imagine.


AUGUST 24 —LUNCHTIME UPDATE— NICE PICTURE OF SUN GETTING LOW

(Click to enlarge)
Once the sun gets this low at noon, clear weather can involve more radiational cooling than radiation. The only thawing you get comes from imported warm air, or from the seawater beneath the ice.
Last year at this time the camera had moved much farther down towards Fram Strait, and any sort of southeast wind brought warmer air from a closer Atlantic. It is no longer fair to compare the pictures from this year with last year, as they represent different latitudes.
It looks to me as if the line in the distance that I took to be a “lead” of open water early in the week has closed up. There is what may be a small area of sun shining on open water in the far distance, on the horizon just right of center, and also what may be a narrow non-reflectlive line of lead below the horizon to the left. My guess is that the ice is crunched together again.
ON AUGUST 13 AT 1500Z—83.780°N — ON AUGUST 24 AT 1500Z — 83.803°N
Our camera started drifting south again today. It still isn’t as far south as it was eleven days ago.
Last night’s foggy spell saw temperatures rise to 0.4°C at 1800z, but since then the sun popped out, and temperatures fell to minus 3.5 (25.7 Fahrenheit) at 1200z. By 1500z they had risen slightly to minus 3.0, perhaps due to a gradual wind shift.
The view from the camera is still sunny, but with high clouds hinting at a change. The lead in the left distance has reappeared.

BEAUFORT GYRE’S ICE-COVER INCREASING?
There are two main currents in the arctic, shown below:

The cross-polar-flow of the past week has opposed the “Transpolar Drift,” and I imagine ice traveling that railway line were switched over into the Beaufort Gyre turntable. We have seen our camera fail to take the usual line down to Fram Strait, and its ice blocks all other ice to the north.
Where would such a switch cause ice extent to increase, and where would it cause a decrease? It would seem you should see a decrease in Fram Strait, and an increase in the Beaufort Gyre. I was wondering how to find data about such a change, when I chanced upon a map at http://stevengoddard.wordpress.com/2013/08/24/62-increase-in-arctic-ice-since-last-year/ which compares this year’s ice cover with last year’s, on this particular date. (Greenland is on the top:)

Green shows the increase in ice over the Asian side of the Beaufort Gyre, and also the “headwaters” of the Transpolar Drift. Red shows the lack of ice “downstream” in the Transpolar Drift.
Other reasons have been given for the regrowth of ice shown by green. For example, it has been suggested that, by having that area ice-free and exposed to cold winds at the start of last winter caused the water to chill more, the entire column of water from the surface to the pycnocline, roughly 400 feet down, when ordinarily that water would be insulated by ice, and the entire column wouldn’t cool to the same extent. That might explain the cooler summer, as the seawater would be cooler, and it might explain the reluctance of ice to melt or to break up in storms, but it doesn’t explain the Transpolar Drift failing to move the ice.
In any case, it makes watching ice melt all the more interesting.
AUGUST 24 —EVENING UPDATE— NORTHWEST PASSAGE, BEWARE!
Glancing at the DMI maps it occurred to me that the western part of the “elephant” of sub-five-degree air over Canada is smaller, and, when I wondered where that air went, I noticed the storm by the Northwest Passage. It well could be sucking that very cold air (for August) south into its circulation.


There are a fair number of people who are attempting the Northwest passage this year, and who have been frustrated by more ice than usual. It seems to me this storm could increase their frustration, especially if really cold air gets drawn south. (The minus ten isotherm has appeared for the first time this summer, northwest of Queen Elizabeth Island.)
The cross-polar flow seems on the verge of a complete breakdown, as the low over western Siberia, combined with the ridge of high pressure extending north from Scandinavia to east of Svalbard, are not merely hindering the flow, but sucking air south from the flow’s source regions.
The map looks very unstable to me, in that it has the Northwest Passage low, the Icelandic low, and the Siberian low all on one side of the Pole. Teleconnections would suggest the harmony of a fourth low over towards Bering Strait. Instead there is high pressure predominate, with a center in East Siberia. It just seems something is off kilter, and things need to change to get “in balance.”
There is significantly less of the arctic above freezing than there was this morning. The only advance of above-freezing temperatures I see is in the western Kara Sea, which surprises me, as that is the one place where sea-ice lingers on the Russian coast.
AUGUST 25 —MORNING PICTURES— A PASSING BERG
This mornings pictures are quite beautiful, and remind me what I originally came to the “North Pole Camera” to see: Beauty.
The scene continues to look cold, quite different from the more slushy views of recent years. Of interest to me this morning is a berg on the ice across the lead, to the left about a quarter of the way across the horizon. It the doesn’t appear in last night’s picture, and is brilliant white in today’s first picture and more of a silhouette in the second. Compared to a rise on the closer side of the lead, it can be seen that this berg is moving from left to right. It also looks like the lead has closed up in the second picture.


I contend that such bergs are formed by crashes between flatter plates. Judging from what I’ve seen this summer, leads form and then close repetitively, and the edges can become a jumble of piled up chunks.
The front associated with the occluded storm over Iceland is still well to the south, but it looks like the high clouds are coming north. I’m not sure how long this beautiful weather can last. Most recent “army” data states it is -4.5C at our camera (23.9 Fahrenheit.)
DMI MORNING MAPS — A POLAR SPIRAL


Last night I was griping that the concept of “teleconnections” stated you couldn’t have three lows at three points of the compass without having a fourth at the fourth point, and that the map seemed out of balance. This morning you can see an Aleutian Low at the top of the map. So everything is OK. Sorry for griping.
The high pressure in the Arctic Ocean north of eastern Siberia will drift out over the Pole, and lows will rotate around the Pole, which is a nice and harmonious pattern. For a while the Pole will be, in a sense, sealed off, with east winds circulating around the high and over the tops of the lows, and that may see a pool of colder temperatures develop over the Pole. However eventually the top will wobble, and things will get out of whack, and arctic air will break out somewhere.
Right now things are a bit backwards, with west winds spiraling out of the Pole. The spiral begins close to the Pole, on the far side from our camera, curves south and east out into the Beaufort Sea and then the Northwest Passage, and finally curves southeast over Baffin Island and into the Atlantic at Greenland’s southern tip. The relatively mild air that was over the Pole is being drawn over the Beaufort Sea, where temperatures are roughly five degrees warmer, and the cold “elephant” of air that was there is gone, shifted southeast as an arctic outbreak that is making life miserable for people attempting the Northwest Passage. Most of those intrepid sailors seem to be abandoning the attempt, and the chief concern seems to be getting boats out before winter ice traps them.
It is much safer to stay at home and watch ice melt from the comfort of a computer, and then step outside to the beauty of a late summer day. The green seems much greener.
AUGUST 25 —AFTERNOON UPDATE— WINDS SHIFTING TO SOUTH
As the wind shifted temperatures hit a low of -4.9°C at 2100z yesterday, rose to -0.8°C at 1200z, and then dipped back to -1.5°C at 1500z. The wind also reversed our wrong way buoy, which made it as far south as 83.801°N at 1800z yesterday before screeching on the brakes and heading back north to 83.882°N. At this rate we’ll never make it to Fram Strait.
The view from the camera is gorgeous. The berg in the background is a bit further to the right.

AUGUST 25 —EVENING UPDATE— DRAT! LENS OBSCURED.
I was afraid of this, with that low crawling up the east coast of Greenland towards our camera. Hopefully the bits of sleet and frozen fog on the lens will melt off soon.
Last year it was like this day after day, and you only got occasional tantalizing glimpses of murky shapes in the growing dark, until night fell, at first involving only one out of four pictures, and then three out of four, and then all the pictures were black, until the last one showed a picture of the searchlight of an icebreaker coming to pick the camera up. However this year we are much farther north, and can hope for less Atlantic fog and more clear, dry, arctic air.
I think that darker smudge in the center of the picture is our buoy, seen through thick fog and a messed-up lens.

However it is what we can’t see that exasperates me. Off in the distance a huge pressure ridge might be piling up as our ice floe is pushed north, and smashes into others, or is smashed into, and…..I’d see nothing.
The “army” data states that at our buoy is still below freezing, at -1.39 Celsius, (29.5 Fahrenheit,) and also that the buoy is still crunching north, at 83.86 degrees north latitude. If it crosses 84 degrees again I imagine there will be some fuss, on some websites.
DMI EVENING MAPS — ATLANTIC LOW TAKES ON SIBERIAN HIGH


The pressure map shows a low over Baffin Island bringing a cold northwest flow over the intrepid sailors braving the Northwest Passage this summer. (Time to turn around, fellows.)
The map also shows a warm flow aimed directly at our buoy between a low north of Iceland and a strong ridge of high pressure extending north from Scandinavia to Svalbard. (The high pressure is what is forsing the Icelandic low north.) This flow of moist and reletively mild Atlantic air seems unstoppable, however (there is always a “however,”) marching across the Arctic Sea is a high pressure area coming from Siberia. That high is rolling up its sleeves, and looks like it is thinking of popping the Southerly flow right in the snoot. Quite a fight is shaping up. Who would believe watching ice melt could be so suspenseful!
In an attempt to be scientific and objective I turn to the UK Met map, to have a better look at the Icelandic low:

This map shows the storm north of Iceland is already occluded. A lot of its warm air is hoisted up high by the occlusion, and the storm is also sucking in cold air from Greenland’s icecap, and lastly, the waters north of Iceland are not warm like the Gulf Stream. The storm’s warm sector is pinching shut, and most of its warmth will be squeezed over towards Scandinavia. In other words, that low isn’t as tough as it looks. I’m putting my money on the Siberian High, who I will henceforth refer to as Igor.
Not that this low won’t mess up our camera’s pictures for a while, and not that the southerly flow won’t mash our buoy’s foundation of ice north against other ice, however I doubt the mild air will spear into the heart of the arctic, like the last one did.
The DMI temperature map shows nearly the entire arctic is below freezing, which is to be expected this late in the summer. Some really cold air lies just northwest of Greenland, but I expect it will be pushed west and away from our camera, as the Atlantic Low and Igor do battle.
AUGUST 26 —MORNING UPDATE— THAW ARRIVES AT CAMERA
“Army” data reports camera up to 0.81 C degrees (33.4 Fahrenheit) temperature; and up to 83.90 north latitude.
Lens washed free of ice, viewing grey day.

Have to run to work. New school year starting here.


AUGUST 26 —AFTERNOON UPDATE— GRAY DAY’S STAY
It looks like we are in for a prolonged spell of gray weather, as the Atlantic low looks likely to stall south of our camera and just meanders about there for a couple days.
After dipping to -1.5°C yesterday our camera experience a passing pulse of warmer air, peaking at 1.2°C at 0000z today, and since then temperatures have eased back nearly to freezing, at 0.2°C at 1500z. The “army” temperature report from the same camera, which seems to read a bit lower, is currently at -0.19 C.
Strong winds pushed the camera north from 83.882°N to 83.952°N in the past 24 hours. That is roughly four miles north. The motion nearly stopped, even as the winds continued, which makes me wonder if the ice runs out of room. Up to a point it can compress like an accordian, simply closing up cracks between the sides of open leads, but at some point it would seem the ice has to start crumpling. At that point northward progress would be harder.
It is hard to see well in the gloom our camera gazes across, but visibility is a bit better, and it looks like the lead in the distance is open, however the berg that was on the far side has shifted out of the picture.

AUGUST 26 —EVENING UPDATE— IGOR VS RONALD
Yesterday I decided to name the Siberian High Pressure advancing towards the Pole “Igor.” Today I’ve decided to name the storm north of Iceland, “Ronald,” as it advances towards the same Pole. At our camera we have ringside seats on a battle, and this evening’s picture makes it quite clear that the fog of war has descended.

Actually I don’t see the value of a ringside seat, if all you see is fog, but I actually can see a little, if I squint. Of course, there is a danger with fog that you are imagining things.
For many years my experiences with low visibility, (fog, and also heavy snow,) were a land lubber’s. Often I’d be walking across an open field, able to see nothing in any direction, and the first thing I would see as I neared the edge of a field would be the faint, looming shape of a tree. Then when, at age eighteen, I first experienced being at sea in a fog, (back before there was such a thing as a GPS,) and could see nothing in any direction, and was miles from shore, my brains kept seeing ghostly trees, at the very edge of the fog, where no tree could possibly be.
Nonetheless, and well aware of the danger of seeing things, I’d say the lead in the distance is closing up again.
DMI MAPS —EVENING UPDATE— ROUND ONE TO RONALD


In my eternal quest to be an artist and no tedious, fact-driven scientist, I’ll cast all objectivity to the wind and anthropomorphize the heck out of these maps.
The Icelandic low Ronald has brought the crowd to its feet by refusing to be timid (and occluded) at the start of round one, and by delivering a devastating right cross of above-freezing temperatures nearly to the Pole. This vast right arm endears Ronald to European fans, as it brings them the embrace of high pressure up from the Azores. Meanwhile Ronald has delivered a mysterious left jab sucker-punch right to Igor’s midsection, crumpling Igor’s rotund shape to a crescent. (Obviously Igor should have spent more time training, and less time hanging around the coast of Siberia the past week.)
Igor’s initial surprise at Ronald’s onslaught has given way to a look of sheer enmity colder than ice. Right where Ronald sucker-punched, the “elephant” of sub-five-degree cold has ballooned like a bicep to its largest area of the summer, and Igor’s Big-Chill-Cold is as close to the pole as Ronald’s thaw. But Igor is staggered. Can he counter-punch from such an angle? Stay tuned for round two!!!
Meanwhile, back at our camera, winds are backing from south to east in the fog, and the ice our camera is on may stop crunching north and begin grinding west. After achieving 2.245°E longitude at 0000z, it has been shoved back to 1.648°E at 1500z.
AUGUST 27 —MORNING UPDATE— IGOR ADVANCES
I am very busy, but a quick glance at our camera’s view shows me things are thawing again.

A quick check of the “army” data shows temperatures are up to 0.06, or just a hair above freezing. Our “companion” buoy roughly 100 miles northeast, Buoy 2013B: is just a hair below freezing, at -0.05 C, and north of there but not to the pole, Buoy 2012J: is colder, at -1.02. To the south in Fram Strait, on the ice just off the coast of Greenland, Buoy 2012M: stands at -0.66 C in “Ronald’s” northeast winds.
I wish I had more time to study the DMI morning maps. There is something fishy about that weak low denting “Igor’s” gut from the Canadian side, but Igor is definately charging acoss the ring towards Ronald, and nearly to the Pole.


The isobars suggest southeast winds pushing our camera northwest, and “army” data shows our camera is nearly back to 84 degrees north, at 83.96 N, 1.22 E.
LUNCHTIME UPDATE —THAW CONTINUES
The “army” buoy’s latest report is temperature up to 0.22 C, (32.4 Fahrenheit,) with the camera blown back to 83.99 N, 0.64 E. Lead in background looks wider.

AUGUST 27 — AFTERNOON UPDATE— CAMERA NORTH OF 84 DEGREES AGAIN.
Our camera has now moved over the 84 degrees latitude line for the fifth time since they shipped it over that line back in April to park it by the pole. It has moved from 83.952°N at 1500z yesterday to 84.009°N at 1500z today. It is also heading west towards the meridian, moving from 1.648°E to 0.494°E. In essence we have spent two weeks going nowhere.
Temperatures have remained just above freezing all day, due to the influx of “Ronald’s” Atlantic air. They have risen from a low of 0.1°C at 1800z yesterday to a high of 0.8°C at 0900z and since then fallen back slightly to 0.6°C at 1500z.
Here are the DMI evening maps. I hope to have time to discuss them later, but need to work until dark.


DMI MAPS —EVENING UPDATE— IGOR COUNTER-PUNCHES
“Ronald” looks a bit flattened in the above maps. Not only are his isobars squished out into an appendage to the east, but the brave thrust of above-freezing temperatures towards the Pole has been brushed aside into a narrow slot of isotherms north of Greenland.
I have the impression Igor is taking control. The dent, ( or “sucker-punch,” or “something-fishy,”) feature on Igor’s Canada-side is being swirled around and shrugged off into the Aleutian Low. (If it was a fish it is now a fish standing on its head.) Rather than attacks from the south making Igor weaker, Igor is stronger. Rather than Igor dancing to tune of outside influences, outside influences are dancing to Igor’s tune.
Round two goes to Igor.
It will be interesting to watch the temperatures at the center of Igor. Although the sun never sets up there, the polar sun is getting low in the sky. And even in southern lands, temperatures start to drop from the heat of the day before the sun actually sets.
Back at our camera, the “army” buoy is reporting an abrupt drop in temperature to -1.88 C, and up at the companion buoy to the northeast, which fell from 0.7°C at the 2100z report yesterday to -1.4°C at the 1500z report today, the most recent “army” data reports temperatures have dipped to, (I could say “crashed to,” or “plunged to,” but I’m not the mainstream media, even if I do call weather systems by first names,) -4.06 C!
Brrr! That doesn’t sound like Ronald’s air, so I shift to our camera to catch a glimpse of what is going on:

To be blunt, that 1800z picture still looks pretty “warm” to me. The drops of water are still water, on the lens. The only difference I can see is that the dark line in the distance, which I take to be a “lead,” is still wide to the the far left, but appears to be crushing together again to the center. I await the next picture with bared breath. Stay tuned!!!
A HUMBLE CONFESSION OF MY COMPLETE FAILURE TO BE PROPERLY SCIENTIFIC.
I have sought advise from other sites, but no one has explained to me why, here at the site where true artists gather to watch ice melt, when the wind vane at the “North Pole Camera” is from 180 degrees, the buoy moves towards 180 degrees, and when the wind vane states the wind is coming from zero degrees, the camera moves towards zero.
I may be making some obvious mistake, but I use an old-fashioned idea that 180 degrees is another way of saying, “south.” (Click to enlarge.)

I get huge pleasure from our camera, and would be the last to criticize the fellows who set it up. As they do the set-up, in sub-freezing temperatures in April, a guy has to stand by with a gun, in case a polar bear decides to be something other than cute, and make a lunch out of a guy with a huge IQ but a body-weight a tenth as large as a bear’s.
However I think they got two wires crossed as they set up the wind vane. This is an assumption, but when I was a young teenager back in the 1960’s I got an electronic wind vane for Christmas, with wires and a genuine indoor display, and a great deal of assembly was required, and when I was done a north wind registered as south, and an east wind registered as west. Therefore I know mistakes are possible.
(Hopefully the mistake is not in the physical vane, but rather in a computer program.)
However the funny thing is that I was so sure I myself must be making some mistake that I came up with some somewhat elegant reasons for ice to go upwind, (if I do say so myself.) Check back in my site, if you want to see me making an elegant ass of myself.
(I decided at one point that the magnetic pole must be south of our camera, and that the compass readings were towards the magnetic pole rather than the actual pole. The camera itself states, “Wind Direction (Magnetic degrees From).” and that made me hunt down the location of the magnetic pole. Unfortunately it was not south of our camera, and rather is northwest.)
I don’t want to get some intern in trouble for failing to do what the professor demanded, nor do I want to get some professor in trouble for delegating work to an inept intern. As I said, I am thankful those guys gave us the view our camera gives. However I will confess to a bit of unscientific behavior on my part, from now on.
From now on, when our camera states the wind is north, I will assume it is south, and when our camera states the wind is west, I will assume it is east. (I’ve been trying this out secretly for some time now, and it is amazing how the ice moves the way the wind blows, when I do so.)
AUGUST 28 —MORNING UPDATE— COLDER CAMERA CROSSING MERIDIAN
The “army data, which refers to our camera as Buoy 2013E: , reports we have moved west to 84.02 N, 0.00 W, and the temperature is -1.88 C, (but that temperature may not be updated.) The two buoys towards the Pole were colder at last report, however the DMI 0z temperature map shows a narrow slot of above-freezing temperatures have squirted into the generally easterly flow around Igor, north of Greenland. The sub-five-degrees air that formerly was there has been rotated around north of Canada.


The low I call “Ronald” is now describing one of those counter-clockwise loops that these northern lows tend to go through when they occlude. It’s warm sector is basically detached and way over in Scandinavia, and Ronald is just spinning well-mixed air, with most of the features aloft. However the impulse of Atlantic air it injected north did push the DMI graph of temperatures north of 80 degrees back to normal. (Notice how cold “normal” is starting to be.)

The two 0z pictures from our camera this morning are taken ten minutes apart. Notice how much darker the sky gets to the right in that short time. The snow stake in the foreground now clearly shows white at the bottom, indicating the ice there has diminished. The lead in the background seems wider, especially to the left.


AUGUST 28 —LUNCHTIME UPDATE—COLDER AND GLIMPSES OF SUN
The “army” data reports the camera is now at 84.01 N, 0.48 W and temperature is -2.71 C. The lead in left background looks wide open as the ice that our camera stands on shifts due west.

QUICK AFTERNOON UPDATE
Buoy data out: Farthest north was 84.033°N at 0900z. Back down to 84.025°N at 1500z. Most movement is to the west, from 0.494°E at 1500z yesterday to 0.638°W at 1500z today. Meanwhile temperatures have dropped from above the freezing point, at 0.6°C at 1500z yesterday to below the freezing point of salt water, bottoming out at -2.9°C at 0900z and then rising slightly to -2.0°C at 1500z.
For the moment the Big Chill is back.
AUGUST 28 —EVENING UPDATE— CLEARING AND COLD
A bit of wan sunshine has broken out, and there may even be a bit of an ice-bow arcing up in the sky to the left. You can see the ice at the far side of the lead in the center, and at the far left, but I can’t see any about a quarter of the way across the screen, which would make it a very wide lead. (The camera is actually quite low, and not all that good at giving us a bird’s eye view, (no penguins at the north pole.) A seal’s eye view is more like it.

I hankered to see further, so started using the camera from outer space, and trying to locate our camera in views such as this one: True Color Arctic Satellite Image It has been too cloudy lately to get a precise view of our camera’s ice, and in any case I couldn’t find a map that would allow me to zoom in very far. However it was a wonderful way to waste an hour.
If I was a scientist I’d likely wind up naming individual cakes of ice, and program a computer to recognize them even if they drifted to a different location, and to reconstruct them if they broke in half. I’d become an authority on what happens to them when they bump other bergs, and the conditions that erode their edges and also the conditions that heap up ice on their edges, as we see to the right of our camera’s view. In the process I’d waste more than an hour, and my wife would likely divorce me. So it turn out I’m actually lucky to have only an hour to waste.
One fascinating feature I noticed to the northeast of Svalbard, where the open ocean gives way to sea ice, was an elongated shape I took to be ice, at the very edge of the broken slabs of sea ice and open water. It was as if the wind and waves had created a sort of ice barrier-island out of bashed up chunks of ice that all congealed together. The edges were smoothe and curving, where the slabs beyond the “barrier island” were angular and straight-sided. I wondered if I was seeing the start of ice expansion.
DMI MAPS —EVENING UPDATE—


This is as close as we’ve seen in a while to a nice, neat zonal pattern, with a high centered on the Pole and lows parading around it as the Pole was a maypole. Admittedly things are a bit staggered, but the high I dubbed “Igor” is swinging east winds around the pole, with the east winds over the tops of a necklace of low pressure areas. (Igor is extremely offended I used the analogy of a necklace, and has asked me to return to the analogy of a boxing ring.)
Looking over satellite pictures earlier made me aware that what I described as a “sucker punch to Igor’s rotund belly” was actually a rather neat and tight swirl of low pressure. No wonder it “looked fishy.” As it joins forces with the Aleutian Low, and a Siberian Low attacks from Igor’s homeland, and Ronald persists east of Greenland, Igor may decide to exist stage left, and beat a hasty retreat for Canada. Computer models no longer show him standing triumphantly atop the Pole Next week.
Meanwhile Ronald is no longer delivering the punch from the south he once did. While the memory of that punch still exists as a sliver of above-freezing air like a feather in Greenland’s hat, northeast winds are sucking below-freezing air past the northeast corner of Greenland and down its east coast. Ronald is looking like he plans to exit stage right, and to wander punch-drunk along the north coast of Eurasia, reaching Bering Strait in around ten to twelve days.
The sub-five-below isotherm has swung west on east winds around the pole, and now is more of a threat to the Alaskan coast than to our camera.
Ronald failed to drive warmth to the heart of the arctic, and now nearly the entire Arctic Sea is below freezing.
AUGUST 29 —MORNING PICTURE— SNOW FLURRY

MORNING DMI MAPS


The maps show “Norman” wobbling away across the Atlantic, and “Igor” reluctant to step to center stage atop the Pole, though his winds are circling the pole. A new gale is forming west of Iceland, but this one is likely to cross the Atlantic further south, and its surge of warmth is unlikely to do more than nudge temperatures up above freezing briefly up the east coast of Greenland. “Ronald’s” speak of above freezing temperature still exists north of Greenland, (though sometimes I’ve noticed such pockets are artifacts of non-updated data; I think this map is automatically generated.) The “army” data shows temperatures in the -3.5 C range in that area, and the Arctic Ocean is quite cold over all.
AUGUST 29 MID-MORNING PICTURES —TWO VIEWS FIVE MINUTES APART—


These two views, five minutes apart, demonstrate how a change of lighting, caused by a cloud passing over the sun, can make playing the game of “can you spot the differences between these two pictures” dangerous, especially if you are squinting at the lead in the left distance trying to observe sea ice, (and also if bits of frost are on the lens.)
They are cold pictures. “Army” data shows the camera is mostly headed west, and just creeping a hair south of 84 degrees again. Temperature was down to -3.85 C but is back up to -3.47 C (the “army” data I look at fails to give a specific time.) Those temperatures, down nearly to 25 Fahrenheit, will freeze any splashed water to the sides of bergs, and chill the ocean itself towards freezing.
SOME BEAUFORT SEA NEWS
Glacing at the DMI maps I became curious about what looked (judging from isobars) like a land breeze from the southeast bringing warm air from the land up from the southeast towards the northwest, and warm, orange isotherms right along the arctic coast at the border of Alaska and Canada further that impression. However a quick check of the Beaufort Sea bouys shows it is actually colder than it’s been, perhaps due to “Igor’s” east winds cycling the cold air north of Greenland over that way.
“Army” data shows Buoy 2012H at -3.28 C; to its northwest Buoy 2012L: is at -3.67, and a new buoy to the northeast, Buoy 2013F:, is at -4.26 C. Look back to the start of this post and you can see it wasn’t long ago that a lot of this region was above-freezing, and barely below freezing when it wasn’t actually thawing. Now temperatures are solidly below freezing, and it won’t be long before the minus-five and even minus-ten isotherms become all but permanent residents. The Big Chill has arrived.
Now the question is: When will the sea-ice extent graphs stop trending down and start trending up. (This involves my big, fat ego, because I’ve failed to keep my mouth shut, and said the freeze would start early.) (Click to enlarge.)

AUGUST 29 —AFTERNOON UPDATE— CAMERA STARTING SOUTH AGAIN
The regular data (as opposed to the “army data”) is in, and shows our camera once again starting south, passing 84 degrees for the sixth time, moving from 84.025°N at 1500z yesterday to 83.982°N at 1500z today. Longitudinal motion has been steadily to the west, to 1.521°W at 1500z today.
(One thing I don’t understand is how we can see movement to the west-southwest, but the Navy “drift” maps show movement to the north-northeast. http://www7320.nrlssc.navy.mil/hycomARC/navo/arcticicespddrfnowcast.gif ) (Maybe they are using our screwed-up wind vane.)
The temperatures fell to -3.7°C at 0600z and have risen back to -1.9°C at 1500z.
AUGUST 29 —EVENING UPDATE—
Clouds back; lead in distance closing up. DMI map shows winds likely backing to north with “Ronald” moving away. New area of minus-five cold across the Pole.


AUGUST 30 — SUNSET FOR THE MIDNIGHT SUN
Roughly 180 miles south of our camera, (at 80° 48′ N,) the sun will set for the first time in months today, and two minutes later it will rise again. Only a two minute night, but a night all the same, and the the nights get longer very swiftly, that far north. The following night, (August 31,) will be an hour and 58 minutes long, and the next night, (September 1,) will be two hours and 53 minutes long. On the equinox, (September 22,) the night will be twelve hours long all over planet Earth, but at the Pole it is the end of a six month day and start of a six month night. At our camera the change is not quite so abrupt and complete, however the lengthening of the nights is dramatic by our standards.
Assuming our camera hangs around at 84 degrees north, and doesn’t drift too far south over the next week, we will see our first sunset on September 8, and our first “night,” (actually a period of twilight,) will be one hour and 35 minutes long. It will be a moment of melancholia, for it will mean the beginning of an end for views from our camera. If there are clouds twilight can be very dark, and all too soon the views from our camera will be black rectangles.
As we have seen, even before the sun sets it starts to get colder. The Big Chill is already growing. But this is no reason to get all bummed out. When the weather is clear there will be gorgeous views of a sunset which, in the arctic, goes on for weeks.
These two views, taken roughly five minutes apart, give a hint of that sunset, and also show a decent ice floe on the far side of the lead in the left distance. The most recent “army” data states our camera is at 83.95 N, 1.58 W, and the temperature is -1.75 C.


AUGUST 30 —MORNING DMI MAPS—
Today’s maps show two things. First, the low I call “Ronald” and the high I call “Igor” have moved away from our camera and are sparring on the Siberian side of the ring. Between them a flow of air is injecting some above-freezing air towards the pole, but also some sub-minus-five air has been rotated around (and home-grown) and will enter the fray.
Second, the area of low pressure systems extending from the southern tip of Greenland northeast to north of Scandinavia and Siberia matches the boundary between colder and warmer waters, or the border between ice-covered and ice-free waters to the north. With the AMO warm this battle-line is displaced northward, and with the PDO cold and ice building on the Canadian side, we temporarily have a lop-sided pole, especially this time of year. Only when the Atlantic side freezes can you have conditions on the ground conducive to the theoretical ideal, which would have a high pressure atop the Pole and a merry-go-round of low pressure systems wheeling around it.
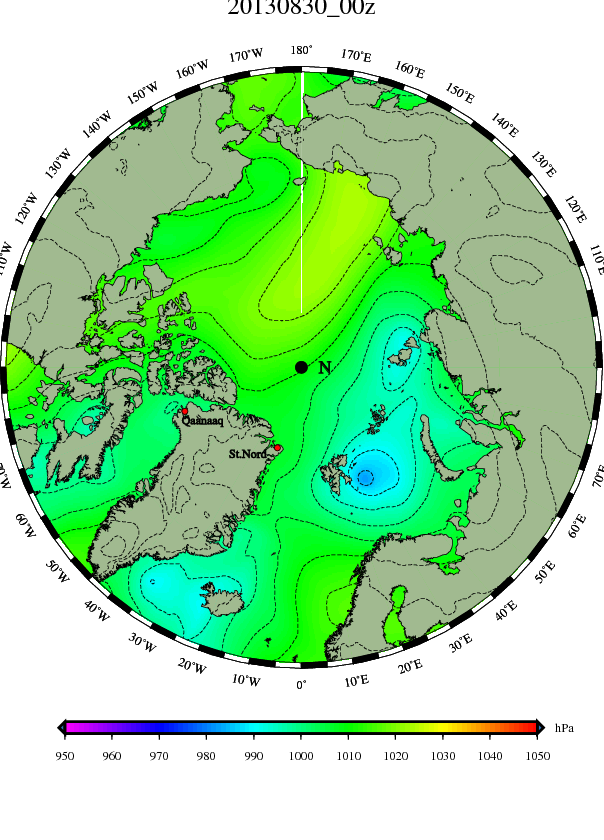

SOME MID-MORNING SURPRISES
The first surprise is a nice, silhouetted view of saw-toothed pressure ridge on a floe, about a quarter of the way across the horizon, to the left, passing on the other side of the lead. It has moved slightly to the left in the next picture, taken three minutes later, and is further left and vanishing in the gloom in the third picture, taken ten minutes after the first.
This shows how mobile these floes are, how independent they are of each other, (the last passing neighbor was moving the opposite way,) and lastly the pressure ridges support, I suggest, my contention that these plates don’t just pulverize to powder that melts, as they collide with each other, but crumple and build up depth even as they decrease in area.


Two other surprises involve temperatures warmer and colder than I expected, in the “army” data. While “our” buoy is reporting -3.10 C, Buoy 2012J: is a hair above freezing at 0.02. As this buoy is closere to the Pole to the northeast, it may be that tounge of above-freezing air extending up from Siberia in the DMI morning map, and may suggest a sneak attack of milder air from the north at our buoy, later today.
Meanwhile Buoy 2012G: is reporting a frigid -11.95 C air (10.5 Fahrenheit) at a location north of the Queen Elizabeth Islands where the most recent DMI map doesn’t even show sub-five-degree air.
LUNCHTIME PICTURES — TEN MINUTES APART
The ice across the distant lead is no longer moving independently of our camera’s ice, which I suppose means they have locked fenders someplace.


AUGUST 30 —EVENING UPDATE— SHIFTING AND GRINDING
With only a slight shift in the direction of the wind, our camera stopped moving west after reaching 1.595°W at 2100z yesterday, and has since moved back to 1.500°W at 1500z today. I assume ice ran into ice to change directions without the wind helping. The southward drift has remained fairly steady, from 83.982°N at 1500z yesterday to 83.908°N at 1500z today.
I was waiting for a sneak attack of slightly milder air, but temperatures only rose around a degree to -1.1°C at 1600z yesterday, and after staying at that general level to 0600z today, they abruptly surprised me by dropping to -2.6°C at 0900z. They have since recovered to -1.7°C at 1600z, but I have no idea where that pocket of cold came from.
The camera shows some ice grinding by with the lead nearly closed, but there may be some open water beyond that passing ice. It’s hard to see in the gloom.
The second picture is 8 minutes after the first and the third is 2 minutes later.


Quick glance at DMI maps shows much more sub-five-degree air, and the only south winds invading the arctic coming from not-so-warm Siberia. I may comment more later, but then again I may not. After all, it is Friday night.
AUGUST 31 —MORNING UPDATE— MAJOR CHANGE: PRESSURE RIDGE GONE
I’m glad I went out last night, but I did miss the large pressure ridge, which has been to the right of the camera’s view all summer, splitting off. It likely slid off to the left. The two pictures below are taken seven minutes apart.


CRASHING AND CRUNCHING — PILING UP VS DIVERGING
In the area our camera watches the world from, the “Navy ice-speed-and-drift map” shows quicker ice (red) ramming into slower ice, (blue,) which would pile ice up, but also it shows some divergence, (ice moving west-northwest next to ice moving southwest,) which would create a lead of open water.
These Navy maps don’t always match the motion we get from the camera’s GPS. For example the latest “Army” data from our camera states it’s at 83.82 N, 1.19 W, which would be a southeast drift. (However the Army and Navy are not known for agreeing about things.) (Click to enlarge, and click again to large more.)

MID-MORNING UPDATE — BETTER PICTURES OF MISSING PRESSURE RIDGE
Clearing skies reveals the new, low horizon to the right, with what seems to be the open water of a lead on the horizon. This camera is placed in a low place, with less ability to see over the horizon than camera one, (which is now face down in the snow,) once had. Therefore the edge of the ice is closer than it looks, and the situation has an element of excitement, because we could see some nearby action before the arctic night falls. The pictures are taken ten minutes apart. (click to enlarge.)


SATURDAY MORNING DMI MAPS


Actually the pressure map makes me think I should be paying more attention to things at home, because when you get the big lows stalling east and west of southern Greenland you can sometimes get a wall of high pressure building south of them (off the above maps,) and that wall can sometimes steer hurricanes in to New England. So…if such a situation starts to develop to the south this post may abruptly get fewer updates.
On a whole the pressure map is out of balance. The Aleutian low needs to come north and be stronger, and the lows either side of Greenland need to spread apart. Then the map will be more balanced and symmetrical and proper and well-behaved. (Not that weather ever behaves itself.) I am going to dub the storm just north of Iceland Thidwick, and keep an eye on it, as some models have it take an interesting left turn over Scandivavia in ten days and become a storm right over the North Pole. (Not that long-range models are ever correct.)
The battle between the low “Ronald” and the high “Igor” is ongoing even as they weaken, and the flow between them has led to an imbalance in temperatures much like the imbalance in ice-cover, over the pole. In a sense it exacerbates a situation, even as the situation perpetuates their existence. The Asian side of the pole continues milder as the Canadian side continues cold. Ice is growing and piling up on the Canadian side as it continues the summer shrinkage on the Asian side.
The Northwest passage is closing up and a number of ships are seemingly trapped until next summer. The quote below is from http://mainstreamlastfirst.com/we-row-into-cambridge-bay-the-official-conclusion-of-our-mainstream-last-first-expedition/ :
“…Our ice router Victor has been very clear in what lies ahead. He writes, “Just to give you the danger of ice situation at the eastern Arctic, Eef Willems of “Tooluka” (NED) pulled out of the game and returning to Greenland. At many Eastern places of NWP locals have not seen this type ice conditions. Residents of Resolute say 20 years have not seen anything like. Its, ice, ice and more ice. Larsen, Peel, Bellot, Regent and Barrow Strait are all choked. That is the only route to East. Already West Lancaster received -2C temperature expecting -7C on Tuesday with the snow.”
Richard Weber, my teammate to the South Pole in 2009 and without doubt the most accomplished polar skier alive today, is owner and operator of Arctic Watch on Cunningham Inlet at the northern end of Somerset Island. Arctic Watch faces out onto our proposed eastern route. Richard dropped me a note the other day advising: “This has been the coldest season with the most ice since we started Arctic Watch in 2000. Almost no whales. The NWPassage is still blocked with ice. Some of the bays still have not melted!”…”
At the “army” Buoy 2012G: north of Queen Elizabeth’s Islands it was -12.49 C at last report, a depth of chill not exactly replicated by the tiny circle of minus-five-isotherm on the DMI map. Meanwhile above-freezing areas lie across the pole north of eighty degrees. According to the DMI graph of average-temperatures-north-of-80 degrees, the average usually is down to minus three.
Although perhaps it is always warmer on the Asian side and colder on the Canadian side, it seems our camera is at a good spot to watch the conflict between the two.
LUNCHTIME PICTURES —CORRECTION— PRESSURE RIDGES STILL THERE
This is somewhat embarrassing, but I can only suppose the contrast was so bad the pressure ridges to the right became invisible this morning. Either that or they moved and then moved back, which I doubt. In any case, I’ll study these pictures more carefully before opening my big mouth. The second picture was taken five minutes after the first, and the third ten minutes after the first.


AUGUST 31 —DMI EVENING MAPS


The isobars between the low “Ronald” (and its northern appendage,) and the High “Igor” continue to have significance, but now it is not only due to a southerly flow bringing above-freezing temperatures from Siberia towards the pole, but also because the air curving around “Ronald” is running into an appendage of “Igor,” which is a high spilling off Greenland and building north of the low I call “Thidwick,” north of Iceland. This new High is quite cold, as is “home grown” cold at “Igors” core, but between the two is a sliver of above freezing temperatures on the DMI map which even shows up as a curve of cloud in the satellite pictures. Our “companion buoy” roughly 100 miles north is 4 degrees warmer than “our buoy.” North of the “companion buoy” temperatures are likely colder again, (though the “army” buoy which could report such cold is not reporting, for some reason.)
Of greater interest to me is that the air swinging around “Ronald,” plus the air swinging around the small Greenland High, are reversing the trend that jammed ice from the Asian side of the Pole towards the Canadian side. Ice may be dispersed out towards the open seas north of Svalbard, exposing a weakness in the concept of “ice extent graphs.”
The weakness is as follows: If you take an area of 100% ice, break it into pieces, and spread the pieces out, the area of ice will remain the same, but the “extent” will increase, especially if you use a figure such as “15% ice coverage” as a a minimum cut-off point. In theory you could quadruple extent, by taking a square mile of “100% ice” and turning it into 4 square miles of “25% ice.”
I have a hunch we have seen the opposite so far this year, with spread out ice, of a large extent, being crammed together into a more solid mass, but with a “lesser” extent. This creates the false impression the ice has melted more than it actually has. It also leads to an interesting variance in the slopes of the “area” and “extent” graphs, as seen below.
NORSEX AREA GRAPH (CLICK TO ENLARGE)

NORSEX EXTENT GRAPH

If my hunch is correct, and if “Ronald” starts dispersing ice out towards Svalbard, then I’d expect to see an uptick in the “extent” graph without any such uptick appearing in the “area” graph.
BEAUTIFUL EVENING PICTURE COMPARED TO LATE JUNE
VIEW ON JUNE 29

VIEW ON AUGUST 31

We are now at the end of the melt-season, and there are indeed signs some melt has occurred. The snow is gone, and the pressure ridges in the right distance are reduced. Likely their reduction is partly from below, as nine tenths of an iceburg is underwater, and those pressure ridges have spent three months floating through “summer warmed” waters. As their keels shrunk they had less buoyant ice beneath to shove their peaks up, so they slumped a little. (I think one reason I thought they were gone this morning was because their peaks didn’t stick up over the horizon as much, and a very low bank of clouds was able to fool me into thinking the cloud-line was the actual horizon of the ocean.)
In actual fact the ocean looks more clogged with bergs, at the moment, than it did in June. There is also a lack of melt-water pools which (if you refer to the start of this post) were so apparent last year, (although of course that was in part to the fact the camera had drifted roughly 200 miles further south.)
Now it seems the Big Chill is starting to set in, though when I named this post I expected it to be more severe. We have not seen temperatures at our camera return to the -8.0 levels they reached early-on, nor have we seen the ice-extent graph bottom out early, as I expected. Indeed the only thing that has happened as I expected is that I have been wrong a lot. However that is how I learn.
I was expecting a pool of balmy air to sneak-attack from the north, and indeed our “companion camera” made it up to 0.1°C at 1500z. However here 100 miles south we got a different sneak-attack, and after rising to -1.7°C at 1500z yesterday, and then settling slightly and again rising again to -1.7°C today at 0300z, rather than balmy air I think we got air delivered by that high bulging off Greenland, and temperatures sank to -4.8°C. So it looks like I was wrong about the sneak-attack of mildness as well.
No sooner did I start to focus on how our camera was not heading south, when it started south. It has progressed from 83.908°N at 1500z yesterday to 83.827°N at 1500z today, while continuing east from 1.500°W to 1.134°W. Interestingly, our companion bouy to the north was moving the opposite way, and doing so with haste, moving from 0.428°E across the meridian to 0.196°W. I do not suppose that bergs drive as well as we humans do, and there may have been some collisions between lanes of oncoming traffic, which may explain why our companion buoy stopped heading south at 85.249°N at 0000z, and got nudged back north to 85.271°N at 1500z. (And if such collisions nudged it north, we might have been nudged south as well.)
In any case, though my learning process involves being wrong about many things, I am not as wrong as some so-called “experts” who claimed the “science was settled” and the arctic would be ice-free this summer. Though I have been wrong, they have been wronger. Therefore, as I am humble, they should be humbler, yet they are not.
I think it was the sheer arrogance of such so-called “experts” that started my process of searching in the first place. I seemly am not alone, as is shown by the fact that this obscure post on an obscure blog where 20 “views” a day was a big deal has now had, according to WordPress, 2,360 “views.”
I am not sure how to use the various WordPress view-counters to figure out if a viewer is a “repeat-customer,” (and if my mother was alive I’d assume all 2,360 “views” were hers,) however a few kind comments have made me aware some do return to this small site for news, and therefore I’ll continue my layman’s-commentary until the camera goes dark in October.
However this post has grown so long, and contains so many pictures, that my tired, old computer is starting to have trouble loading it, when I post updates. Therefore I’ll have to reluctantly terminate this post, with a link to to a new one.
The question then becomes: What to name the new post? I think I will name it, “The Arctic Sea-ice Minimum; A September Surprise.”
What will the surprise be? Well, it won’t surprise anyone if I am wrong, but I think the surprise will be seen on the “extent” graph. With all the ice crowded over to the Canadian side of the Pole, all it would take is a decent cross-polar-flow for a week the opposite way, and all that ice would be spread out like butter on toast, and the “extent” graphs would leap upwards in a manner that would surprise people.
Even if that doesn’t occur, I think I have shown evidence that the arctic is not on its way to becoming “ice-free” any time soon.
These observations will continue at https://sunriseswansong.wordpress.com/2013/08/31/the-arctic-sea-ice-minimum-a-september-surprise/
Sorry for any inconvenience the switch-over may cause.

Funny when you look at your graphic on Arctic Sea Ice Extent you don’t see that sudden downward blip (obviously an error) that appeared to occur a few days ago. On the other hand, at SGoddard his graph still show the blip: http://stevengoddard.wordpress.com/2013/08/18/arctic-grows-back-eight-years-of-ice-loss-in-just-one-season/
“Disillusioned” over at Goddard’s site was correct. My graph is the DSI 15% extent graph, and the one Goddard shows is the 30% extent graph.
First of all, thanks for the great information you’re posting here!:-)
Now,
“… According to NOAA analysts, a CME hurled into space by an M3-class solar flare on August 17th… ” (http://spaceweather.com/)
and I think the flare is related with the spike in the Arctic temperature shown in the DMI chart (pretty much at the day of the flare), but I don’t know how to explain it.
When I saw the spike, the thought came to my mind that it was related with a flare, without actually knowing if it had occurred or not. I believe that because of the (relative) dryness of the atmosphere recently, the entire climate of the world is becoming (or has become) highly sensible to solar flares.
I believe that if the flares stop completely or become very low the rebounding of the Arctic ice will accelerate.
If this is true, then the rate of the cooling of the climate in the years ahead, in relation with the present solar (grand) minimum, could be larger, more accelerated, than most people are expecting.
Thanks for the compliment.
While I am aware of the correlations regarding the sun, and often mutter, “It’s the sun, stupid,” I am ill-equipped to supply any sort of causation.
I am thankful you alerted me to the recent flare, and will be alert to possible effects it may have.
I will also keep it handy as a convenient excuse, should I be pulled over for speeding.
“Good sir,” I will say to the officer, “Are you aware we are under the influence of a M-3 class solar flare?”
(He will likely think I’m under the influence of something else, but sometimes, if you can get those guys to chuckle, they let you off the hook.)
Hehe, you’re welcome Caleb, thank you for your answer.
This whole thing about the flares, I believe, is in the mind of many who are studying these phenomena related with climate and its “forcings”, because there is always one aspect or another that seems not clearly understood.
I think this relation with solar radiation was not so “perceptible” just a few decades ago (due to the problem of “dryness” that I mentioned), although Steven Goddard has posted some information about large melting during the early 60’s (and other sites about similar phenomena during the WWII “warm years” in the NP) that it was already present, to some extent, in those years too.
I tend to believe that we’re now in a point of unstable equilibrium in terms of world climate and the entire situation we have now will change abruptly (not necessarily catastrophically) in the near future.
Because the Sun has been driving us to colder averages since 2008, I believe the direction of the change (cooling) is already set.
BTW, beautiful children you have in the picture of this site! 🙂
Interesting ideas. And I’m sure that if flares effect our electrical lines then they effect other things as well.
Sometime I’d like to write a humorous post about how plankton effects the weather. Big ocean storms can actually suck sea spray up to the Stratosphere, and the chlorine in salt, and bromine and iodine in plankton can effect the chemistry up there, reducing ozone levels. I suppose a solar flare could either encourage or discourage the growth of plankton, but what I’d have in my post is this little bit of plankton cruising about the stratosphere, muttering to itself, “I knew I should have stayed home last night.”
I tend to see things in terms of crude cycles, and think we are in a period like the 1950’s, with the PDO cold but the AMO still warm. It is roughly a sixty-year-cycle, but the “quiet sun” is a new factor thrown into the mix.
I like that picture too. It is from six years ago, when we were just opening the childcare at our farm, and had traded a goat for three little pigs. The blond girl is my granddaughter.
This site is a little gem Caleb. I have learned a lot since I have been coming here. Thanks.
You’re very welcome. And, if you look back over the summer, and see my mistakes, you’ll see I’ve learned a lot too. I find it enjoyable to learn-as-I-go. Also it seems somewhat necessary, when you are trying to be an “educated voter,” and to “double-check the authorities.”
Hello , hope you do not mind but i have just contacted Gav ,and told him what a great job you are doing ( hes been recruiting to his weather team just recently ) so as you are definately ‘talent’ I thought i would connect you guys , cheers Anthony
(within the last minute) anthony holmes said:
Hi Gav , dont know if you have discovered this guy yet , I have been rooting for the arctic to recover its mojo ( because several long time ‘experts’ on TWO said it was probably heading for a cliff to show how doomed from warming we all are } anyhow this excellent guy has lots of info all in one place and I reckon his site is a ‘gem’ and updates most every day . Do check it out . sunriseswansong.wordpress.com/2013/08/16/the-big-chill-sea-ice-version/
No, I don’t mind at all. I just like it to be clear that I am a layman and am learning as I go, and often learning from mistakes.
If I were to “root” for a certain cycle to take over in the arctic, I think it would be best for humanity to see a warmer arctic such as existed when the Vikings first arrived in Greenland. However, because such kind weather would encourage Alarmists with their Global Warming nonsense, in the short term a couple of very cold winters might be better.
In the end, however, we cannot depend on weather to give us good leaders. The goodness in mankind must rise up and shrug off the wickedness, and that is a very high matter a pawn like myself has little control over, though I am also aware pawns have their part to play in the Great Chess Match.