
The real news, (or at least the news to me), this summer has been the persistence of the general area of low pressure I dubbed “Ralph”, at the Pole. According to the general theory of atmospheric circulation, which has Hadley, Ferrel and Polar Cells neatly arranged between the equator and the poles, the North Pole should be an area of descending air, and air pushing down makes high pressure.

It doesn’t make sense to have low pressure , indicating rising air, sitting in the middle of a cold, ice-covered sea surrounded by hot, sun-baked tundra. Yet it continues to happen. How can it be? Shouldn’t the air be rising over the hot places and sinking over the cold?
All I can do is watch and observe, for one thing I have come to understand is that the weather will not bow to me, and is not cowed by the brilliance of my bright ideas.
When I last posted, Ralph was filling in over the Pole, awaiting his next shot of reinforcing juice, which I dubbed “R13”, (which stands for 13th reinforcement). This impressive glob of energy was pulling mild air into the Kara Sea, and the good ship Northabout was reporting mild winds with temperatures up over 60 ° F at the western edge of the Laptev Sea. They were hunkering down to wait out a storm that was forecast to brew up, as this mild air mixed with the sub-freezing air to the north.


Indeed on the 14th R13 became a tight little low in the Kara Sea.


Then I missed some maps due to other storms, (in my life), and by 12Z on the 15th Ralph had gathered in R13 and was turning into the 4th largest summer gale since 1979. The warm air involved had risen and surface temperatures were below freezing in the middle of the storm. There was hope among those-who-want-to-see-ice-melt that this storm would be like the gale of 2012, and huge amounts of ice would melt, but this didn’t seem to happen.


As Ralph whirled at the Pole it seemed to be cut off, and to lack fronts and the intense winds and wind shifts which are near fronts. Ryan Maue mentioned it lacked warm air avection, but it looked like several streamers piped in some energy aloft, the most clear of which shows (in the temperature maps) as above freezing temperatures funneling around north of Greenland, and getting temperatures above freezing at the Pole at 12z on the 16th. I might as well call that R14, but it wasn’t enough to fuel Ralph, and he started to fill and fade, and to look around for more reinforcements by the 17th.


Then I had to deal with another personal storm, and missed some more maps. Ralph continued to weaken, but R15 was coming through Bering strait to the rescue.


R15 grew to be quite tight and strong, and in the old days I would have called it a secondary and named it “Ralphson”, but, because I am boss here, I’m allowed to change the rules when I feel like it, and I’m just going to do what I’ve done all summer; and that is to state the Ralph was glad to get the reinforcements, and absorbed them to fuel his next incarnation. He was a tight and powerful little low now, over the thickest sea-ice in the Arctic Sea, that is piled up against the Canadian Archipelago. Clouds hid what happened to the ice, but I imagine it got churned, like all the ice has been churned this summer.


By the 21st Ralph was again fading, but a nice juicy surge of energy was being drawn up into Barents Sea and a weak low was rotating around Ralph, crossing over Svalbard. Say hello to R16.


24 hours later R16 and Ralph were joining hands and forming a big and enlongated area of low pressure from the Pole to the Kara Sea.


This quickly becomes the next incarnation of Ralph, moving into the Laptev sea. The cold over the Pole was intensified, and early on the 23rd we see the first small spot of the minus 5° isotherm appear, this side of summer. However milder air is being pumped north from Siberia to the east, even as Ralph pumps the first frosty blast south into Siberia to the west.


By the 24th Ralph has started to weaken again, and the weak secondary in the west of Kara Sea lacks the juice necessary to really be a reinforcement. It is too cold.
Also a strange thing is appearing off the coast of Alaska, and south of Svalbard. In case you can’t remember, it is called high pressure. Indeed it looks like Ralph is starting to be squeezed. Could this be it? Is Ralph at long last doomed to fade away?
The only hope for a R17 lies in the fact warmth has been drawn up into the East Siberian Sea, and a triangle of low pressure pointing southeast from Ralph over the New Siberian Islands may hint of hope in that direction. But the hope seems slim.


Twelve hours later Ralph is fading fast. But hark! Is that the sound of the cavalry’s bugles, from the East Siberian coast? (In case yuh yungstahz doan know dis, bugals iz wut our coppers had afore our police cars had sirens. I tink duh sirens wuz too loud, an skared de horses.)


Yes! R17 is riding to the rescue from East Siberia, even as Ralph is going down for the third time. However the sinister forces of anti-Ralphism are building in the Beaufort Sea, north of Canada.


And this evening, as we conclude this highly scientific examination of maps, we see the Ralphist forces lined up on the Eurasian side of the pole, as the anti-Ralphist interlopers rally north of the Canadian Archipelago.
Who will win this epic battle? And will the howling Pacific-to-Atlantic winds between the armies blow all the Pole’s sea-ice into the Atlantic through Fram Strait?
Tune in next week, to the next exciting installment of, “Watching Paint Dry, Ice Melt, And Other Things More Exciting Than Doing The Dishes.” Either that, or else….


….cheat. Flip ahead in the book and read the ending. How? By looking at the computer models.
The current Canadian JEM model (interpreted by Dr. Ryan Maue, with a free week trial of his art available at the Weatherbell site), shows both the unseasonable blast of cold, which Ralph shot down into West Siberia, but also the milder source-region for R17 in East Siberia, with temperatures between 40°F and 60°F.

What does the northward surge of R17 do? Gosh. Big surprise. Ralph is again resurrected, and in three days sits over the Pole as a 978 mb gale.

Is Ralph a warm storm, full of thawing?

Looks pretty cold to me, but maybe where the wind is strongest in the Beaufort Sea there may be a slot of temperatures a hair above freezing. For the fun of it, let us focus on the arctic waters in that “thawing” slot.
Are those areas of open waters between bergs warmed by winds a hair above freezing? Probably not. Why? Because those waters are two hairs above freezing, and therefore the winds are cooling them. Furthermore, the waters are likely warming the winds, as heat is robbed from the open seas.
Then there is the matter of “phase changes”. When ice becomes water, or water becomes vapor, the phase changes of ice-to-water or water-to-vapor involves available heat turning into latent heat. (That is why your wet skin feels so cool in a breeze, after a swim.) And this same cooling occurs to arctic waters when the roaring wind induces evaporation.
But how about the phase change from solid to liquid? This occurs when snowflakes fall into salt water. (That is why your icecream-maker works, when you mix ice with salt; the melting sucks up heat.) In other words, when Ralph drops any precipitation as snow (which O-buoy 14 has seen a fair amount of) it has a cooling effect, as flakes melt in open waters.
But what about the sunlight shining into the open waters? Does not that warm things?
What sunshine? Ralph tends to be cloudy.
In other words, using the “extent” of sea-ice, and assuming it is a good metric for how much the polar waters will be warmed, might be a decent tool when high pressure sits over the pole, and there is a lot of sunshine. It is then that the talk about the “albedo” of white snow versus the “albedo” of blue waters makes sense. However Ralph makes a mockery of that logic.
The fact of the matter is that we are facing a new situation here. If you want to live in the past you can look back to 2013 in my notebooks, when the boss of the Pole was in some ways high pressure systems, including one I dubbed “Igor”. (Those old posts are so full of ignorance they make me cringe, but even when high pressure dominated the Pole I found plenty of reasons to be skeptical of the simplistic “albedo” theory.) Here is the map of August 19, 2013 to show that high pressure played a bigger role back then than it played this August 19.

Considering I could spot reasons to doubt the “albedo” theory even when high pressure made a situation conducive to belief, and even when I was a novice, just imagine the levels of my doubt now, when “Ralph” makes a situation which makes such blind belief look like a three-year-old’s, and I am slightly less naive.
As far as I’m concerned, anyone who currently believes in the “albedo” theory has failed to pay attention. Like a heroin addict, they have figured out ways to lie their way around facing facts. They live in a bubble.
If you look at the above maps, you will see that the one place, where Ralph’s effects fail to reach, is the Northwest Passage. If you wanted to avoid facing what Ralph demonstrates, all you needed to do was shell out around $20,000.00 for a berth in some fancy liner cruising the Northwest Passage this year. I think floating bubble is called the “Fistula Surgery”. (I could be wrong.)
People aboard that boat haven’t a clue about what is occurring further north, above their heads.
Me? I just observe, and post some charts and maps.
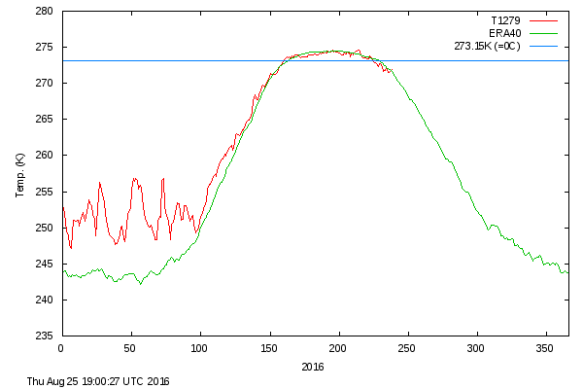
Despite the summer-long churning of the sea-ice, it has refused to melt away to record levels:

This is a wake-up-call. Back in early May, when the above graph showed the “extent” was extremely low, the people-who-want-ice-to-melt were hoping for just one storm like the storm of 2012, to set a new record. Ralph’s persistence has been like getting what they wished for, timed ten. The various incarnations of Ralph, according to them, should have set a new record.
All the storms should have have created much open water. That in turn should increase temperatures at the Pole. Look how warm the period after the end of the melt season was in 2012.

I would expect the same this year, with the sea-ice pulverized, and crisscrossed by leads of open water from end to end. Is it happening?
No. This is not to say we might not see the open areas make air temperatures above normal later, as all that water freezes over, (for freezing releases the latent heat that thawing sucked up), but even if it happens, it is different this year.
The difference is something that even those-who-want-ice-to-melt should recognize, from within their bubble. The albedo theory is essentially trashed. Time to concoct a new one.
Me? Oh, I’ll concoct some humorous theory, but be well aware Infinity laughs at me, when I box it with my mind.

Reblogged this on WeatherAction News and commented:
Such a good read…as always
Thanks. I am always pleased when you enjoy my posts.
I am also pleased when the weather pulls an ace from up its sleeve, and baffles all of us with something quite unexpected.
I confess to scratching my head a lot. I cannot claim I saw this coming. However it sure is fun to watch. And I think we all may be taught a thing or two, in the coming months.
I am really enjoying this series of reports. It looks to me as if, based on your maps, (and seeing all the vessels now in the Northwest Passage underway through their AIS systems) that the waters o that passage are clear and will remain clear, which is just what those people on the Crystal Serenity want, and which will then “confirm” that the polar waters are ice-free. Do you agree? Or do you think these weather systems will drive sea ice down on Serenity’s route?
Looks to me as if they have clear sailing. It will likely give some a false impression of the state of the arctic. But some have a way of wanting false impressions that is unseemly.
For example, they want things to be good so badly they believe the governments unemployment figures, and then wonder why youth is so disgruntled.
This is a key point in all of this discussion. The analogy of the government’s unemployment figures -those we all know are twisted and backflipped- and the clearly forlorn youth is perfect.
Thanks. I think they will luck out and have a successful passage.
Don’t have much time … she who must be obeyed will be ready to go out in a minute. Your circulation diagram is terribly over simplified. My old textbook from the fall term of climatology in 1975 has a better one with the height difference of the tropopause detailed ie arctic much lower than tropic. Diagram is pulled from Palmen 1951 and Barry 1967.
Later.
Send me a copy to post, if you can.
Over-simplification is the bugaboo of eloquence.
But Oh! How we yearn for eloquence! “Cut to the chase”, we grumble, for the unknown is like a foreign language, and we desire a interpreter who is fluent in that tongue.
But the unknown is also complex, and involves Chaos Theory. And so it turns out even a magnificent eloquence like E=MC2 is a gross simplification.
So what are we to do?
“We are poor little lambs who have lost our way. Baa! Baa! Baa! We are little black sheep who have gone astray. Baa! Baa! Baa!”
By the way, check out “Paul Maxit’s” thought-provoking comment at the end of the post before this one.
He suggests I should be paying more attention to departing highs than imports of “reinforcements”.
As usual, I have been too simplistic, and need to broaden my grasp.
Holy moly … here is my old text book (revised many times I suppose) but now 90 bucks Canadian and I bot mine for $5.95 in 1975!! Talk about inflation. https://www.amazon.ca/Atmosphere-Weather-Climate-Roger-Barry/dp/0415465702
I was hoping it was so old that it was online free and I could send u to the chapter on atmospheric motion which has all sorts of stuff to tickle your noggin.
Think how rich you would now be if you bought a hundred of those books!
I’ll keep my eyes open for a used copy om line.
Hi Caleb, loved your post. Did you have a textbook that you learned the meteorological basics from or just the web? I’ve got an engineering background but want to learn more as you have. I’m growing tired of all the screaming and name calling on the climate sites and just want to figure some shit out for myself. Your posts are my favorite to read and it calms my nerves after reading the comments on the other sites ( not that I don’t enjoy it). Thanks for the interesting and thoughtful posts.
Back when I was 18 I did get a meteorology textbook for Christmas, and strove to study it. Unfortunately I have a weakness, due to the fact I spent all my Math classes in school gazing out the window studying meteorology. About half the book involved a level of math I’d never achieved, and it was all Greek to me.
If it had been my fate to become a meteorologist then I suppose fate would have introduced me to a tutor at that crucial point of my life. In actual fact I did meet influential adults, but they all focused my mind on writing and studying history and psychology, and I missed a lot of important learning which you, as an engineer, know is vital.
As I wandered ahead in life I tended to pick up a minimal amount of math, in order to do things such as figure out how much paint to buy to paint the wall of a house. For the most part I studied weather like an old farmer does. I also picked the brains of every person I could find, especially outdoors-men. Fellows who spend a lot of time outside gain an uncanny skill, when it comes to forecasting. The odd thing is many don’t know how they know; they just know.
My love of history was basically a love of stories. Back in the day I used to hitchhike a lot, often over long distances, and many people liked to talk. I used to call them “hundred-mile-friends”, and I learned many things you don’t read in history books or the newspapers.
One bit of history I’ve always loved is the tale of the Greenland Vikings. This taught me a lot about the Medieval Warm Period. Therefore I was very aware when some thought it might be a good idea to “erase the Medieval Warm Period.”
I think it was arguing about Vikings and the Medieval Warm Period that was my entry into the wonderful brawl about Global Warming. My weakness in Math meant I got trashed on a regular basis during debates, but I have always called making a fool of myself “a learning experience.” Slowly but surely I have picked up a rudimentary understanding of things that used to be Greek to me.
In the debates some try to shut me up with some sort of disparaging put-down such as, “You know only enough to be dangerous.” I think I’d be wrong if I used such statements as a way to stop learning, so I always try to respond cheerfully, with some question such as, “Really? What do you think I should study?” The way people respond often allows you to separate the people who are really interested in the Truth, from those who are merely slick talkers.
I hope that answers your question about how I came to know the stuff I’ve picked up. I have even learned a little about engineering. (My youngest son is a Civil Engineer.) However I never would presume to call myself an engineer.
Regarding “all the screaming and name calling” in the Global Warming debate, I fear it can’t be avoided. I too find it tiresome, but perhaps I am made thick-skinned because I deal with children all day. Children can get into the most purple-faced debates about absurd things, such as who owns a single stick in a forest full of sticks. One has to learn how to walk into a brawl and not get caught up in all the emotion. Having a sense of humor is a very great tool, when it comes to being a peacemaker.
Also people tend to stop being offensive when you are actually interested in what in in their brains. True, it may be balderdash, but I don’t need to tell them so, (or at least not right away.) I find that, midst all the balderdash, most people have some interesting stuff in their skulls. That tends to be a silver lining even on the darkest cloud.
Thanks Caleb! And you gave me a good idea. Being of Norwegian descent I’m gonna read up on the Vikings in Greenland in my next history book I read. Right now I’m reading Guns, Germs, and Steel which is about how the current (last 2000 years) came to be in terms of who ended up conquering who and why, so it kinda fits with that theme.
I have the sense that studies of the Vikings in Greenland, and anything else that has to do with the Medieval Warm Period, are not smiled upon, in the current political climate.
Here is a paper from better times, in 1997. It holds an excellent summery of much that was known at that time:
Click to access mq22551.pdf
And here is a paper describing the sort of site that should be studied further, not on Greenland but further northwest on Ellesmere Island.
Click to access Arctic33-3-454.pdf
As I understand it, there are intriguing structures up there that have never been excavated. They consist of two parallel walls of stone. They appear to be the right distance apart to hold up a Viking boat. The boat would be hauled out of the water and flipped upside down, to serve as a roof.
Of course, for Vikings to be sailing about up there in the summer would suggest things that might be frowned upon by the leaders in charge of grants and funding, at a college.
Into my mind’s eye comes a picture of an enthusiastic young archaeologist, bursting into an office with an inspired look, and trying to convince an old dullard, who gave up hope of ever discovering anything years ago, to part with some cash.
In some ways I fear discovery is ruled by a mental mafia. However youth keeps coming, wave after wave, and the old are like castles of sand.
Pingback: Week in review – science edition | Climate Etc.
Hi, a very very important post written in an entertaining way. So little is known. In transit at moment but will respond again shortly. Where is the source of your charts, would appreciate. Regards Martin
The charts are from the Danish Meteorological Institute site, on the “Arctic Weather North of 60N” tab.
http://ocean.dmi.dk/arctic/weather/arcticweather.uk.php
Other maps have better detail, but I like theirs for the simplicity and clarity. The temperature maps may be a bit high, or so I thought when there were more reporting buoys on the ice, last year.
Caleb –
I’m a frequent lurker, as I enjoy a good yarn from someone of independent mind.
“Fellows who spend a lot of time outside gain an uncanny skill, when it comes to forecasting. The odd thing is many don’t know how they know; they just know.”
Not at all odd. This is our climate. We evolved in it. Our physical senses are inextricably linked into it (probably mostly subconsciously). It follows that any assertion in climate science which appears to contradict personal experience needs careful inspection.
I too remark your circulation diagrams (here, and another in an earlier post which I’ve mislaid), which show orderly cellular flows fenced by jet-streams. Are you aware of earth.nullschool.net? If not, try
https://earth.nullschool.net/#current/wind/isobaric/250hPa/orthographic
which shows that reality is much more complex disorderly interesting dynamic than that.
We are told that “the jet-stream” (meaning the Arctic one, in another instance of NH bias) has become more meridional; you might prefer “loopy”.
Orthodoxy says that jet-streams are air-mass boundaries, which steer extra-tropical cyclones (except for the occasional loose-cannon of a cut-off low). Perhaps you can glean some insights into “Ralph’s” antics from these images.
Mike in Chile –
If your engineering includes the usual thermodynamics, it will serve. I see many comments in the climate blogosphere which clearly are from engineers. I intuit that their professional thumbs are pricking, and they’re trying to discover why. (Disclosure: I’m not an engineer, but speak with them) For entry-level climate, you need only the great physical laws, normal powers of reason, and a few uncontroversial facts (such as the existence of the tropical Hadley circulation). The issue could and should have been presented in good comprehensible heat-transfer terms, but wasn’t. A greenhouse gas can only heat the surface if the air is warmer. It generally reduces surface cooling. Many of those most vocal on the climate issue seem not to make this distinction. Sigh.
Caution: Entry-level climate isn’t difficult, but is beset with easy pitfalls. I see many skipping steps and finding one.
The Danish Maps show 2 “towns” in northern Greenland.
St. Nord – I always read as “Saint” but is actually “Station”. Nord = North. Established during the cold war.
Qaanaaq – Wonderful Palindrome! Wikipedia claims area first settled in 2000 BC. Population = 656.
I also wondered who Saint Nord was. I got so curious I actually researched him. I was disappointed to learn there was no such saint.
Someone is trying to get the poor Inuit in trouble, spelling words that way. The English language is powerful medicine, and more mighty than the sword, and if you don’t put a “U” after “Q” bad things will happen to you. I learned about the bad things from Mrs. Howe, my boyhood English teacher. Also look what happened to Iraq.
There is a lot of mystery and debate about the Paleo-Eskimo, who walked the coast of an Arctic Ocean that was likely ice-free, and apparently littered with driftwood, because the Paleo-Eskimo burned wood and caribou bones. Winters were just as dark, but likely far warmer, as the best guess is that they lived in shelters made of hides.
On the north coast of Greenland the beaches their ruins are found in are above modern beaches, so either the land has risen or the water was higher back then. The interesting thing about the beaches is that they are of water-washed sand, and different from modern beaches that are gouged by bergs.
I seem to recall that traces of Paleo-Eskimo go back 4000 years.
Of course, there may have been earlier people, but their remains would be along a coastline that was submerged when the oceans rose 300 feet.
Caleb,
Not sure you noticed, but this post got linked by Judith Curry at her blog, under the “Interesting things I noticed this week -Science” section – Congratulations, and keep this stuff coming!
Best
Taylor
I couldn’t help but notice. This is a fairly quiet, quirky, backwater site, and suddenly 179 people visited from her site. I was flattered. Hopefully she got a chuckle or two from my humor.
DMI N80 temperatures have not just risen – they’re now above freezing. You need to update your graph. I believe only one other year in the DMI dataset shows temperatures above freezing this time of year.
BTW, snow that falls into -1.8 C water does not melt. It just sits in the water. Wayne Davidson has numerous pictures of this on his website. It does make the eventual refreeze easier, though, for a couple of different reasons.
If you don’t believe in the albedo theory, is this because you don’t believe in albedo, theories, or the just the combination of the two? If not albedo, then why is the arctic warming faster than the rest of the planet? I must admit denial of albedo theory is a new one on me.
This is basically a notebook. I describe the situation as it exists. I cannot describe what doesn’t exist yet.The DMI spike definitely was not foreseen by me.
I know about snow falling and sitting on water. Check out old posts back in 2013. Also I mentioned it in some musings that got published on WUWT in January, 2014.
I’m not sure I like your tone, when you say “I must admit denial of albedo theory is a new one on me.” I never said that. I may have said climate scientists deny it, when in a bad mood, because sometimes it seems they have never stepped outside in their lives.
I have a very sensitive instrument for determining the power of the sun. I call it “skin”. Unfortunately I’ve overused it, but after sixty years most equipment does get a bit worn. But I have a great knowledge of how the sun bounces off snow, and how it bounces off water, because I have spent years outside, whereas some climate scientists are pasty-faced blobs who wouldn’t know a sunbeam from a streetlight. I don’t know why the heck they all have to fly off to sunny beaches in Bali for a conference, when they likely never even leave the hotel. In truth I think the worst are part vampire, and flee the sunshine. They are alarmed by the slightest mouse, fear any sort of risk, and what I call a tan they call “skin damage.” Where FDR said, “We have nothing to fear but fear itself” they screech over a trace gas. What gutless wonders. Someone needs to tell them to calm down. Oh, I forgot. Judith Curry already did. But I digress.
Where was I? Oh yes, regarding skin.
Your skin will tell you that when the sun gets low water is a better reflector of sun than snow, especially when the water is glassy. If you spend long hours on the water you know that when the sun is high it makes golden lines that waver on the sand underwater, but that as the sun sinks those golden lines vanish and it becomes dark and gloomy under water, even when it is daylight above. By the time the sun sits on the horizon water reflects nearly all sunlight. Meanwhile, when snow gets thawed it tends to get dirty. You see this often in sea ice. Some dirt is from volcanoes, some is industrial soot, (largely from China), and a lot is from bergs flipped upside down that have various stuff growing on their bottoms. Therefore sea-ice can absorb a lot more sunlight than new fallen snow, and when the sun gets low in September seawater reflects sunlight like a mirror in a calm.
Last but not least a person who spends a lot of time outside knows you can get a sunburn on a cloudy day. However one also does not deny clouds also have a cooling effect, or that the high sun of noon or June is more likely to sunburn through clouds than the slanting sun of sunset or December. Yet you’d be amazed at how many take a completely moronic all-or-nothing attitude about whether the sun penetrates clouds or not. They need to get out more, and see the amazing variety playing across the landscapes.
Skin also feels things besides the sun, which effect the seawater. There is the cold, and the extra chill added by the wind. There is the humidity, and the salinity you can taste on your lips and even see drifting over the black ice forming on a harbor on a twenty-below morning in Maine.
All these experiences, sensed by people who get off their butts, who stop staring square-eyed at computer screens, give one the definite impression nature and life consist of more than columns of numbers called data. One needs to get outside and live, breathe the fresh air, and then one finds what some dismiss as mere sensation coalesces into experience and wisdom.
I delved into this idea in an essay last year:
By the way, you failed to mention what the one other year was that “the DMI dataset shows temperatures above freezing this time of year”.
Allow me to help you. It was the very first year of the DMI data set, 1958. In other words, we may well be back where we started, in a sixty-year-cycle. (Though I would guess the Quiet Sun will derange the cycle significantly.)
I don’t think 1958 is comparable to this year on DMI N80. In ’58 there was a little minor uptick at the end, but nothing really out of the ordinary. 1984 saw a significant uptick, much like 2016. If this were a 60 year cycle then many Inuit elders would recall the same type of climate today as when they were kids. Can you find *one* that is telling that story? Just one! No, they’re all saying that their traditional (centuries, millennias old) lifestyle has pretty much come to an end.
And while I have Native American ancestry – my father was born on a reservation – I don’t mourn the loss of the lifestyle (I don’t want live as my ancestors did), but it’s notable for what it says about how the climate has changed.
and TP writes:”…due to to the “albedo effect”, which Caleb rightly points out keeps getting disproved ”
Hmm, so I’m not the only one that thinks you deny the albedo theory.
I’ve also sailed on glassy seas. Or, more accurately, I’ve sat dead in the water for several days in glassy seas. But the arctic hasn’t seen glassy seas much of this year. Two to three meter waves at times. But that’s not even necessary, when we’re dealing with microphysics. A photon doesn’t need much wave height to hit a wall and be absorbed as opposed to reflecting elsewhere – which this year is typically up to the clouds and back down again. As I’ve said, scientists measure these effects. Your skin notwithstanding, I’ll take measurements over anecdotes (even my own anecdotes) every time.
Oneilsinwisconsin:
I detect a straw man argument here – no one is disputing (much less your ugly word ‘denying’) that there is an albedo effect, caused by absorption of those pesky photons, that’s measurable. What is in dispute, and certainly not proven by data is the specific notion that more open water leads to runaway albedo-based heating/melting and ice-free Summers soon. I seem to remember the much discredited Dr. Waddams still claiming that will happen any year now.
The natural variation since at least 2007 would seem to suggest the risks are far lower than he and others that use the albedo notion claim. Additionally, the runaway albedo-driven theory wouldn’t explain the recovery from the thirties, or earlier recoveries from low ice periods, including the most recent granddaddy of them all, the Medieval Warming Period that opened Greenland to grain cultivation and cattle grazing.
On the other hand, you offered some data on albedo, which I would enjoy seeing to contrast this season with last year’s. As Caleb has pointed out this season has been cloudy and stormy, so I suspect that some of your photons reflected right back into space and never managed to get down to sea level to be bounced between surface and cloud. I would very much like to see data on how this year’s satellite average measured albedo compares to the past few years, and what effect you think that has to surface heating. If you know where that data is, I’d appreciate a link.
BTW, I never saw a response from you on the question of summer vs winter temperature rise – do you not have an opinion on the data, or is it simply an uncomfortable topic?
Taylor
Well, perhaps you can be reasoned with, if you’ve actually been becalmed at sea and lived on a reservation. (I’d actually like to talk about that more than “albedo”).
I spent four years on and around the Navajo Reservation, not as a bureaucrat or do-gooder missionary, but as a bum, and I smile remembering some fellow’s complete disdain for the US government and university-types. They were pretty scornful of outsiders telling them they had to get licences plates for their pick-up trucks, and I recall one fellow, after years of confusion with army and tribal and Indian-affairs bureaucracies, wound up with three different names, and three social security checks. What I thought was especially funny was the tales they would tell, with completely straight faces, to anthropologists. (Anthropology is a science largely based upon anecdotes.)
Because you have been there and done that, I should think you’d have a healthy skepticism of government-science, somewhere deep inside, and that should include the stuff involving “albedo”.
I’ve also thought about the difference between glassy water and ruffled waters.
Here’s something else to think about:
That northward rush of milder air that spiked the DMI graph up was matched by a southward rush of cold air that brought unseasonable summer-snow to East Siberia and the far east of Russia.
I figure that August-snow, in places falling where the leaves on trees are still green, does a good job of reflecting photons. Likely it will melt away fairly swiftly, but, before it does, how much heat will the planet lose? How much colder will the rivers draining north into the Arctic Sea be? Who collects the data on that?
East Siberia was a sort of jail for Czars and Stalin, and was largely settled by political prisoners, which makes it strangely like a reservation. Here’s a picture from Magadan Oblast, from a couple of days ago:
to oneilsinwisconsin:
When you say the arctic is warming faster than the rest of the planet, are you referring to DMI numbers, one of the surface data sets, or the satellite datasets? They disagree in various ways, much like the sea ice extent numbers (particularly in Arctic summer). In particular lately, the arctic warming seems to take place mostly in Winter (i.e. 250 Kelvin vs. 245K, a whopping 5 degrees of warming, all at least 20 degrees below freezing. Summer temperatures seem more stable, likely because of the effect of sea ice cover, at least in the DMI set, unlike the data sets that extend land temperatures over the polar area, and obviously aren’t trustworthy, although global CAGW policies seem to rely on those numbers.
BTW, this is a great site for enjoying Caleb’s somewhat quirky view of the world, including both his local view and his global view. I find your insinuation that he might not believe is theories to be a childish attempt at an insult. A better approach would have been to ask what his issue is with what some have said is the inevitable downward spiral of ice extent due to to the “albedo effect”, which Caleb rightly points out keeps getting disproved by the pesky reality of the actual ice. If that albedo effect was real, then 2012 would have spelled doom, but that didn’t happen, and I suspect this year’s likely “second lowest in the (recent) record” ice will lead to a rebound next year.
Some have posited that open water, at a time when the air is colder than the water, leads to the water getting colder than if it was covered with ice, thus leading to a head start on the upcoming freezing season, a nice self-regulating feedback mechanism that does not involve CO2. And of course, as Caleb points out, the very flat sun angle on the water this time of year is not likely to have much “albedo effect”, so as previously noted, likely more heat lost than heat gained.
Now of course, this view is subject to data and theory that you might have available, which I (and I believe Caleb) would be happy to hear about from you – that’s the way adult conversations take place at this site.
Looking forward to your response,
Taylor
Thanks Taylor. Very well put.
Another thing to consider is that salt water is unlike fresh water, and sinks below warmer water until it passes below the freezing point and actually freezes. In theory the entire column of water, top to bottom, would need to be cooled to freezing, for the water at the top would keep sinking as it cooled. This obviously doesn’t happen, because any snowflake or frozen spray or existent ice does float, and acts as a sort of seed crystal for growing further ice.
But just because some water does freeze doesn’t mean no water sinks. Water sinks because it gets colder, and also because it gets more salty due to salt being exuded from the freezing ice. This sinking water is part of circulation patterns, and greatly changing the amount of open water is likely to change the location and amount of sinking water and thus the circulation patterns. The circulation patterns are likely also changed by disturbances to the thermocline, halocline and uppermost pycnocline, brought about by the differences between the calm waters under stable ice and the churned water under open sea.
In other words, as always, reality is delightfully complex.
Very well put? Taylor wrote:”Summer temperatures seem more stable, likely because of the effect of sea ice cover, at least in the DMI set”
Now, I understand that working things from first principles is not always easy, but this isn’t rocket science.
What is the temperature of ice?
What is the temperature of ice-filled water?
Which is denser, air or ice and water? I.e., is air going to change the water temperature or is the reverse more likely?
These are very basic physical characteristics that most 12-year-olds know.
Ice cannot be warmer than 0C.
Ice water (fresh) is at 0C; Ice water (salt) is around -1.8C
Both ice and water have higher densities that air.
Now, from these facts we should be able to very quickly determine that temperatures in the DMI N80 area really cannot go much over 0C until all or most of the ice is melted out. That DMI N80 temperatures are almost identical throughoout the summer months is not an indication of stability – it’s an indication that there’s still ice there. It’s an ice-bath fer cryin’ out loud. We use ice-baths as temperature standards because we *know* they’ll be at 0C!
On a side note: Counter-intuitively, less ice-cover can actually lead to lower temperatures over small regions of marginal ice cover — ice has to *warm* to 0C, but the sea below it is typically at -1.5 to -1.8. Exposing the air to the cooler sea can actually lower the air temperature even though the process is the result of ice melting!. Now as the area of open water increases, and the longer it is exposed, it will begin to slowly warm. This become readily apparent in the Beaufort where SSTs can rise significantly above -1.8C over the course of the summer. But the marginal ice zones (which is usually most of the DMI N80 area) will be stuck at freezing.
On the otherhand, winter is when all of the arctic is ice-covered. There is no ice-bath physically constraining the temperature to a narrow range. This is when warming can easily be seen. It is also, by theory, when most of the warming *should* occur.
Rather than “well put” Taylor has completely missed the boat on what DMI temperatures mean during the melt season and has completely neglected the physical constraints of air above an ice-bath. He’s also mischaracterized arctic amplification, which has always been expected to be most noticeable in arctic autumn & winter.
As NSIDC put it: “With less sea ice, the refrigerator door is left open: more dark open water is exposed, which readily absorbs the Sun’s energy in summer, heating the ocean and leading to even more melt. With less sea ice there is also less insulation, so that heat from the ocean escapes to warm the atmosphere in the autumn and winter.”
When the sun sets in the arctic you have the huge furnace generating -1.8C of heat. It may be unnatural to think of that as a gigantic heat source, but in polar winter -1.8C is like an oven door being left open. Even where I grew up – a hundred miles south of the Canadian border – -1.8C would be welcome in January and February.
Well put indeed.
In the very first graphic, isn’t the sub-tropical cell circulation going backwards?
I get that same feeling. Something about it just doesn’t seem quite right. But it is what all the Ferrel Cell diagrams show.
Google “Ferrel Cell Images” and check it out for yourself.
Caleb,
I think ‘geran’ is right – check out this link, that seems consistent with others:
http://www.metoffice.gov.uk/learning/learn-about-the-weather/how-weather-works/global-circulation-patterns
Note that the three cells have opposing directions in all the diagrams – the one you posted show all the circulations in the same direction, which isn’t consistent with the ones I found (including the one above).
Best,
Taylor
Not only is geran right, you are right also. I need new glasses. The little arrow at the earth’s surface is going the wrong way in the Ferrel Cell.
On further examination, you are absolutely right. The arrow at the Earth’s surface is going the wrong way in the Ferrel Cell. (I should be more careful; I just grabbed this illustration because it showed “high pressure” at the Pole.)
Thanks again.
TP – when you wrote that Caleb had ‘disproved’ the albedo theory, that’s another way of saying the albedo theory is not true. This is what ‘denial of science’ means: denying the truth of what is accepted as true.
Why do you obsess on datasets. We have thousands of phenomelogical records that tell the same story; dates of rivers and lakes freezing and thawing, flowers blooming, birds arriving, glaciers advancing or retreating, etc., etc. One doesn’t need a single thermometer reading from the past 100 or 200 years to understand the climate is changing.
A 16 or 17 year-old student in Ashland, Wisconsin simply went to the library and looked at 100 years of newspaper records to determine when the first ship arrived in port in the spring. No thermometer involved. Harping on datasets is a red herring that denies the evidence of our collective generations of eyes.
Having followed arctic sea ice for more than two decades I’m well aware of both the deficiencies in theory (models underestimate sea ice loss), in data collection (extent and area both have uncertainties in the double-digit percents), and the numerous counter-balancing feedbacks. It doesn’t change the fact that the last 20 years have seen an 80% loss in ice volume at minima.
Multiple indications indicate that this hasn’t occurred in probably 8000 years – if not millions of years. Again, no thermometers required – just look at the age and distribution of whalebones, phyoplankton, foraminfera, and other paleo-indicators.
There’s so much science out there beyond temperature readings that arguing over thermometer or satellite readings is pointless. The consilience of the evidence points in one direction.
“Multiple indications indicate that this hasn’t occurred in probably 8000 years – if not millions of years”
I don’t know what your “multiple indications” are, but my multiple indications trump your multiple indications. So there.
Umm, I listed several; whalebone fossils, phyoplankton, and foraminifera.
The best evidence for as little or less ice in recent history is from the HCO circa 8kya. Search for ‘beach ridges Funder”
I can list things as well, but it does nobody any good if I don’t have the time to share any links. And please don’t tell me to do searches. I am not sitting about with time on my hands. I barely can find the time to read all your comments.
Kevin O’Neal – “when you wrote that Caleb had ‘disproved’ the albedo theory…”. This seems to be the week for strawman arguments. I said no such thing. i said that Caleb had shown that the notion that albedo-based warming of the arctic ocean due to low ice cover would inevitably lead to a “downward spiral and an ice-free summer’ had been disproved. Perhaps you should restate what you believe the “Albedo Theory” is, so that we may all comment on the same thing.
Additionally, nobody is saying that the world is not warming. That is another strawman that is often used to discredit skeptics. Of course it’s warming, and has been generally warming at a relatively steady rate since the Little Ice Age, thank goodness. What I did point out to “wisconsin” is that it seems like a good deal of the Arctic warming that DMI measures seems to be occurring in the winter, not the summer, which, if the case, would seem to not be a source of major alarm. ‘wisconsin’ has not chosen to reply to that comment, but offers other straw arguments that are apparently intended to show his superiority.
Finally, you ask why I wanted him to show his data – and you found that foolish, since there was plenty of anecdotal evidence. I have anecdotal evidence as well, from newspapers as well – try looking at newspapers from the mid to late 30s (US and globally) and see if today’s temperatures are “unprecedented”. As for the comment about “the last 8000 years”, that doesn’t explain the Viking relics found on Ellesmere Island, nor old tree stumps emerging from melting glaciers. As you pointed out, there is plenty of anecdotal and historical evidence, it’s just not consistent with this being the “hottest time ever”.
Taylor, Taylor. Your comment above is still standing. Perhaps you’ve already forgotten what you wrote.
Taylor Pohlman
on August 28, 2016 at 11:06 pm said:
“A better approach would have been to ask what his issue is with what some have said is the inevitable downward spiral of ice extent due to to the “albedo effect”, which Caleb rightly points out keeps getting disproved by the pesky reality of the actual ice. If that albedo effect was real, then 2012 would have spelled doom, but that didn’t happen, and I suspect this year’s likely “second lowest in the (recent) record” ice will lead to a rebound next year.”
Now, you were saying that I misquoted you? Would you like to revisit that accusation?
I do not typically engage with those who prove themselves to be bad faith actors. You have proved to be of bad faith; disavowing words you wrote and then accusing me of making them up.
– 80% ice loss at minima-
Are you saying that the minima was 20Km2 20 years ago? Minima this year is going to be in the range of 4-4.5 Km2, depending on whose numbers you use, which would imply that 20 years ago it would have had to be 5 times as great, or perhaps you misspoke on your percentages (100% loss would be completely gone, 80% loss would be all but 20% left – that is 80% of 20Km2 would be 4Km2. Careful, throwing around stats like that can be confusing. Check out Charctic, you’ll find that the minima in 1996 was around 7K square kilometers, so today’s reduction will be in the order of 35%. Impressive, but we seem to be bottoming out – been in that range for quite a few years after the big drop.
“Are you saying…” Don’t put words in my mouth and then argue with what I didn’t say.
I haven’t the time to look it up right now, but off the top of my head recall there are some records in the reports of the captains of whaling ships that would blow your arguments right out of the water. Most significant was some point in the period 1810-1820, when a huge amount of ice discharged south through Fram Strait and the waters north of there were amazingly ice free, perhaps all the way toi the Pole. I plan to write a post on this soon. Stay tuned.
Sorry Taylor. I’m in a rush and misread your comment. I was actually responding to Kevin. However the stuff about the ice in the 1810-1820 period still stands.
Ice is a 3-dimensional structure. Extent and area are 2-dimensional measurements.
Sometimes it’s necessary to think about what you’re discussing.
Now, do I need to walk you through the answer or can you figure it out from here?
oneillsinwisconsin and Kevin O’Neil: Re – “80% reduction in volume from minima”
Oops, my bad – discussion had been around extent, and I responded too quickly without noticing that you said reduction in volume, not extent. In checking PIOMAS, however, and looking back to the minima in 1995 (20 years before the last recorded minima in 2015), I see that the actual reduction is about 48%. Again dramatic per their models, but not 80% either. If you have a source for the 80% figure on volume reduction, I’d like to see it.
Caleb, color me skeptical of any such evidence. There were dozens of British whaling ships in the Greenland Sea and the Davis Straits in the late 18th and early 19th centuries. Open water was often seen as far north as 80N in the Spitzbergen area and William Scoresby probably recorded the furthest north voyage of this era (1817) at 81.3N.
And while the British Parliament had offered a £5000 prize to the ship or ships first approaching to within One Degree of the Northern Pole and another £20,000 for the discovery of a NW or NE passage, neither prize was collected. In today’s money those are equivalent to $1.25 million and $5 million.
If any whaler thought there was a chance of open water to within one degree of the pole he would have stowed his harpoons and gone for the gold.
Today of course we routinely see the ice retreat several degrees north of what was then a ‘highwater’ mark. We also see both the NE and NW passages navigable by ships that aren’t even specially designed for sailing in ice-covered seas. One need only peruse the uni-bremen archives to see what we routinely find today. Here’s the first image I looked at to show what *winter* extent in that area looks like today: March 15, 2016
P.S. Considering the curvature of the earth, the horizon is approximately 3 miles away on a clear day. Even from a 100 ft high crowsnest one can only see about 12 miles. Any sailor that would extrapolate over hundreds of miles based on *sight* is telling a tall fish tale. I did mention that I’ve been studying this subject as a hobby for a couple decades, didn’t I?
Oops – wrong Scoresby and wrong year. His father made it to 81.3N in 1806. I should have added that Parliament eventually went to a graduated prize schedule:
83N £1000
85º: £2000
87°: £3000
88°: £4000
None of these prizes were collected in the 19th century. You could collect a couple of them with a few tanks of gas and a jet-ski today.
Can you get me a link to the prize-offers by the Brittish government. I want to know what year they were offered.
Off the top of my head, I think it was the younger Scoresby who found so much open water up the coast of Greenland in Fram Strait, and named a strait (after his Dad, not himself,) that had never been open before.
This is very frustrating to me because I don’t have time to do justice to the topics you question, due to family matters. I’ll do my best to get back to you.
Again off the top of my head, I think it was the younger Scoresby’s report that got the British Admiralty so gung-ho about the Northwest Passage. By the time of the Franklin debacle everything had frozen up.
The Board of Longitude established the original prizes for improvements in instrumentation in the early 18th century. It some years later added the prizes for the Pole and the NW or NE passages.In 1819 it added the incremental prizes for reaching different longitudes.
The London Gazette was the official publisher of these prizes and they can be found in the Gazette dated March 27, 1819
For more information search for “Longitude Prizes” or “Board of Longitude”
Thanks. I’m going to double check, but I think that is after the son sailed.
“you could collect a couple of them with a few tanks of gas…” All depends on where you start. We can be a bit cleverer today than they could be, given satellite images, but you should check out what happened to ‘Northabout’ this season, trying to get through the NorthEast passage. I don’t think any of them would be game to try it on a jet ski, let alone turn much further north than they were able to go. There’s a solid wall just above 80 degrees from Greenland to the Laptev and in places it blocked traffic down into the low 70s. There is a nice run probably to 85 degrees or better on the other side of the Pole, but it’s more of a finger-shaped opening that you’d need to be incredibly lucky to find in a wooden sailing ship with no radar, satellite and even effectively no compass. So no surprise there were no takers.
Oneilsinwisconsin: “Now you are saying I misquoted you…”
Yes, on the topic of “Albedo Theory” you keep insisting that I (and Caleb) for that matter, are rejecting the notion of Albedo-based heating. That is not what I am saying, as a careful read will tell you. What I am saying is that the Notion (it’s hardly a theory at least my understanding of the rigor that implies). that lower albedo in the arctic region, caused by more open water in the summer season, will inevitably lead to further ice reductions, more albedo-based warming, until all the ice is gone in the summer. That notion, call it the “albedo-driven arctic spiral” if you will, is what seems clearly to be not operating, or at least not operating in the dramatic fashion as described by some of its sponsors. The idea that albedo changes and leads to heating, assuming the sun is at a reasonable angle, is not in dispute, and never was, so the idea that we are rejecting “albedo theory” is not true. It’s the “albedo-driven arctic spiral” (which i referred to in the post as the “albedo effect) that I’m rejecting, and if you have evidence that it is operating, please provide references, links, etc. to make your case. The data since 2012 would seem to suggest otherwise, including PIOMAS ice volume, which had a nice rebound since then.
I’ve tried to make this point several times, in an attempt to get you back on track with what I am actually asserting, but for some reason it hasn’t worked, or you are just determined not to get it.
Thanks Taylor. You put that well, and saved me some time explaining, which I currently lack.
What is so amazing this summer is the pounding the sea-ice has taken from “Ralph” the polar storm (or storms), without melting away. Along with the warm Pacific “blob”, the lagged effects of the El Nino, and the end of the warm AMO, you couldn’t ask, invent, or beg-and-plead for a better situation to create an “ice-free-pole.” Yet the ice hangs tough.
I agree about the ice resiliency, particularly after the low maximum and the rapid pace of the early spring decline. However, per DMI, the pace seems to have picked up again, and for once they are coming into convergence with regular NSIDC and their MASIE product as well. Usually this time of year they can be 500 square kilometers apart. I still don’t see a new record, but it will be closer than I thought, at least according to those sources.
Oneilsinwisconsin: “If any whaler thought there was a chance of open water to within one degree of the pole he would have stowed his harpoons and gone for the gold.”
I wouldn’t be too sure on that. At its peak, sperm oil was reported to be selling for $1.77/gallon (in those days) and that would make a single large sperm whale worth around $1,000. Given how many whales a single ship could take, a good trip would be worth more than the prize, and at least those dangers were known ones, vs. wandering north with the hope of finding the Pole. However, while your comment makes great reading, I think your economics and understanding of human motivation needs some work. For some interesting commentary on that, and as a place to start looking for other references, try
sorry not sure why the link didn’t work, will try again: http://io9.gizmodo.com/5930414/1846-the-year-we-hit-peak-sperm-whale-oil
or google “the year we hit peak sperm whale oil”
Taylor – I mentioned bad faith actors; again you prove yourself to be one. “In those days” — no, you’ve chose a price level from the 1850’s when whale oil reached its historic high. The days we were talking of were the late 18th and early 19th century. For 90% of the 19th century whale oil sold for less than $1 gallon, and for the 75%of it was less than 50 cents a gallon. Cherry-picking the high price level and using that as justification is arguing in bad faith.
I didn’t see bad faith. The link Taylor gave explains all that, explaining how the invention of kerosene caused a crash in whale-oil prices.
Personally I didn’t much like the tone of the article, as it took a condescending, anti-whaling tone, and completely missed all the glamour and romance and amazing courage of whalers. My ancestors rolled over in their graves, sat up, and had a thing or two to say about wind turbines killing eagles, and using rare earths that involve hideous strip mining in China. Then they lay back down and left the battle to me.
to oneilsinwisconsin: Lighten up. “in those days” refers to the price in dollars “in those days”, not to your 1819 date. You used the phrase “in todays money” to distinguish values then and now. You seem to enjoy the “bad faith actor” phase, but as Caleb points out, I supplied the link that disclosed the information that you’re using to label me that way. I also was clear that the $1.77 was at the peak, so I’m not sure why you would have the expectation that I had pegged the price at the 1819 date.
BTW, I was being very conservative about the contrast between the prize and what a whale captain could earn. Again, this is the 1850’s but check this out:
“The success of a voyage
When the New Bedford whaler, Benjamin Tucker, returned to home port in 1851, she carried: * 73,707 gallons of whale-oil; * 5,348 gallons of sperm oil; * 30, 012 pounds of whalebone (baleen).
How the profits were divided
After expenses, the net profit of the Benjamin Tucker’s voyage was $45,320. The usual share for the owners of a ship was between 60 and 70 percent. In this case, between $13,596 and $18,128 would have been left to be divided among the captain and crew for several years of work.”.
Link for that is: https://www.whalingmuseum.org/learn/research-topics/overview-of-north-american-whaling/whales-hunting
Doubtless you can find some references to earlier dates, but as you can see, the prizes were not likely to be material as compared to the more certain rewards of just doing their job.
Interesting information. Thanks.
See my other post for the reference, but if a whaling ship was capable of harvesting 70,000 gallons of whale oil, or even half that, then it really doesn’t matter if the price of the oil is $.50, $1.00, or $1.77, the delta between what they could earn and the UK “get near the pole” prize was unlikely to motivate anybody, so I think your comment was not well thought out, and certainly not well researched. Likely your analysis of climate issues is more thorough.
To stay home at the farm was often to merely subsist, in New England. You fed and clothed your family, paid your property taxes by working on the roads, and very seldom saw much silver at all. Here in New Hampshire some farms basically broke even, and the chance for “chink” was to send all ten children out blueberry picking, and then send the berries to Boston by change. I knew an old Finnish fellow who told me his Dad told him not to come home until he had picked ten gallons.
Compare two years on a farm with two years before the mast, and whaling doesn’t look so bad.
BTW, further to the “bad faith actor” non sequitur above, I do notice that you tend to cherry-pick minor flaws in comments, but rarely seem to address the substance of issues raised (like arctic warming is mostly winter warming, that the albedo-driven death spiral didn’t happen after several opportunities, and that statements like “80 percent decline in volume in the last 20 years” aren’t backed up by data and references when challenged). If you want to make a more constructive contribution, vs. try to “tease the rubes”, then engage in real back and forth, as opposed to the sarcasm and belittling attitude that seems to pervade some of the posts above.
Taylor – take the 1979-2000 average PIOMAS minima.
Take the 2012 minma or the estimate for this year’s minima.
Divide.
Report percentage.
Well, I must say this series of exchanges has taught me one thing by example – the meaning of ‘bad faith actor’, as illustrated by your redefinition of your previous remarks that you describe above.
If I read this correctly, oneilsinwisconsin, when you said in a previous post that the sea ice volume had shrunk by 80% in the last twenty years, you really didn’t mean that (at least not after having gotten caught). What you really meant to say is that “the ice volume at the lowest point in the last 36 years is 80% less than the average of the ice volume in the twenty-one year period centered roughly 27 years ago”. I agree that doesn’t have the appeal of your simplistic statement, but it is a fairer description of how one could get to that level of decline (actually a bit less than 80%, but that’s quibbling), and it certainly wouldn’t have brought the necessary rebuttal from me.
Now if you let me pick my favorite more recent year, like say 2014, the answer appears to be less than 50% volume decline. Strange metric that can vary almost 40% to the positive in the space of two years, isn’t it? Must be some natural variability in there somewhere, don’t you think?
Seriously, we are all learners here, and there may well be things you can teach. But your facile mangling of statistics to make them even more alarming is disingenuous, and your attempt to cover your mistake (or misrepresentation) with an aloof sarcasm is pathetic. It certainly will not attract any but the most impressionable followers, short of the kind of coercion that #EXXONKNEW promises.